Strategy Tester Report
USIndexExpert
TradeMax-Live2 (Build 1220)
| Symbol | AUDUSD (Australian Dollar vs US Dollar) | ||||
| Period | 30 Minutes (M30) 2019.09.02 00:00 - 2019.12.13 23:30 (2019.09.01 - 2019.12.14) | ||||
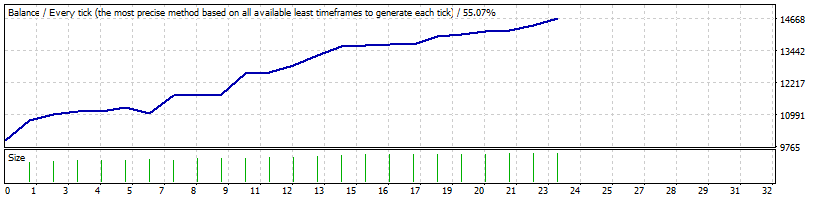
| Model | Every tick (the most precise method based on all available least timeframes) | ||||
| Parameters | StopLoss=500; TakeProfit=300; TrackPeriod=5; TRRR=1.3; MinDev=0.0009; UpATRR=3; UpDPR=0.6; DownATRR=2.5; DownDPR=0.6; MUR=0.05; BandDeviation=2; BandPeriod=20; PassbyFlag=0; OpenFlag=15; | ||||
| Bars in test | 4601 | Ticks modelled | 1600941 | Modelling quality | 55.07% |
| Mismatched charts errors | 0 | ||||
| Initial deposit | 10000.00 | Spread | 20 | ||
| Total net profit | 4696.40 | Gross profit | 4940.94 | Gross loss | -244.53 |
| Profit factor | 20.21 | Expected payoff | 204.19 | ||
| Absolute drawdown | 613.18 | Maximal drawdown | 994.00 (7.24%) | Relative drawdown | 7.96% (907.94) |
| Total trades | 23 | Short positions (won %) | 14 (100.00%) | Long positions (won %) | 9 (88.89%) |
| Profit trades (% of total) | 22 (95.65%) | Loss trades (% of total) | 1 (4.35%) | ||
| Largest | profit trade | 797.53 | loss trade | -244.53 | |
| Average | profit trade | 224.59 | loss trade | -244.53 | |
| Maximum | consecutive wins (profit in money) | 17 (3649.11) | consecutive losses (loss in money) | 1 (-244.53) | |
| Maximal | consecutive profit (count of wins) | 3649.11 (17) | consecutive loss (count of losses) | -244.53 (1) | |
| Average | consecutive wins | 11 | consecutive losses | 1 | |
| # | Time | Type | Order | Size | Price | S / L | T / P | Profit | Balance |
| 1 | 2019.09.02 17:57 | buy | 1 | 1.48 | 0.67288 | 0.66768 | 0.00000 | ||
| 2 | 2019.09.04 16:40 | close | 1 | 1.48 | 0.67826 | 0.66768 | 0.00000 | 786.44 | 10786.44 |
| 3 | 2019.09.16 00:00 | sell | 2 | 1.57 | 0.68612 | 0.69132 | 0.00000 | ||
| 4 | 2019.09.17 11:08 | close | 2 | 1.57 | 0.68469 | 0.69132 | 0.00000 | 224.64 | 11011.08 |
| 5 | 2019.09.18 21:03 | sell | 3 | 1.61 | 0.68298 | 0.68818 | 0.00000 | ||
| 6 | 2019.09.18 21:48 | close | 3 | 1.61 | 0.68236 | 0.68818 | 0.00000 | 99.82 | 11110.90 |
| 7 | 2019.09.19 04:53 | sell | 4 | 1.63 | 0.67912 | 0.68432 | 0.00000 | ||
| 8 | 2019.09.19 14:00 | close | 4 | 1.63 | 0.67910 | 0.68432 | 0.00000 | 3.26 | 11114.16 |
| 9 | 2019.09.24 07:50 | buy | 5 | 1.63 | 0.67866 | 0.67346 | 0.00000 | ||
| 10 | 2019.09.24 13:09 | close | 5 | 1.63 | 0.67975 | 0.67346 | 0.00000 | 177.67 | 11291.83 |
| 11 | 2019.09.26 15:21 | buy | 6 | 1.66 | 0.67780 | 0.67260 | 0.00000 | ||
| 12 | 2019.09.27 23:00 | close | 6 | 1.66 | 0.67636 | 0.67260 | 0.00000 | -244.53 | 11047.29 |
| 13 | 2019.10.01 04:57 | sell | 7 | 1.63 | 0.67387 | 0.67907 | 0.00000 | ||
| 14 | 2019.10.01 18:03 | close | 7 | 1.63 | 0.66969 | 0.67907 | 0.00000 | 681.34 | 11728.63 |
| 15 | 2019.10.16 03:48 | sell | 8 | 1.74 | 0.67371 | 0.67891 | 0.00000 | ||
| 16 | 2019.10.16 13:18 | close | 8 | 1.74 | 0.67370 | 0.67891 | 0.00000 | 1.74 | 11730.37 |
| 17 | 2019.10.16 21:00 | sell | 9 | 1.73 | 0.67587 | 0.68107 | 0.00000 | ||
| 18 | 2019.10.17 02:07 | close | 9 | 1.73 | 0.67563 | 0.68107 | 0.00000 | 41.94 | 11772.31 |
| 19 | 2019.10.17 03:32 | buy | 10 | 1.73 | 0.67767 | 0.67247 | 0.00000 | ||
| 20 | 2019.10.17 21:03 | close | 10 | 1.73 | 0.68228 | 0.67247 | 0.00000 | 797.53 | 12569.84 |
| 21 | 2019.11.06 21:30 | buy | 11 | 1.82 | 0.68824 | 0.68304 | 0.00000 | ||
| 22 | 2019.11.06 23:55 | close | 11 | 1.82 | 0.68855 | 0.68304 | 0.00000 | 56.42 | 12626.26 |
| 23 | 2019.11.07 09:22 | buy | 12 | 1.83 | 0.68864 | 0.68344 | 0.00000 | ||
| 24 | 2019.11.07 13:35 | close | 12 | 1.83 | 0.69014 | 0.68344 | 0.00000 | 274.50 | 12900.76 |
| 25 | 2019.11.14 02:30 | sell | 13 | 1.89 | 0.68229 | 0.68749 | 0.00000 | ||
| 26 | 2019.11.14 11:33 | close | 13 | 1.89 | 0.68031 | 0.68749 | 0.00000 | 374.22 | 13274.98 |
| 27 | 2019.11.15 02:53 | buy | 14 | 1.95 | 0.67989 | 0.67469 | 0.00000 | ||
| 28 | 2019.11.15 23:00 | close | 14 | 1.95 | 0.68159 | 0.67469 | 0.00000 | 331.50 | 13606.48 |
| 29 | 2019.11.19 02:33 | sell | 15 | 2.00 | 0.67930 | 0.68450 | 0.00000 | ||
| 30 | 2019.11.22 01:37 | close | 15 | 2.00 | 0.67903 | 0.68450 | 0.00000 | 54.80 | 13661.28 |
| 31 | 2019.11.28 01:07 | sell | 16 | 2.01 | 0.67666 | 0.68186 | 0.00000 | ||
| 32 | 2019.11.28 10:32 | close | 16 | 2.01 | 0.67660 | 0.68186 | 0.00000 | 12.06 | 13673.34 |
| 33 | 2019.12.02 17:23 | buy | 17 | 2.00 | 0.68170 | 0.67650 | 0.00000 | ||
| 34 | 2019.12.03 03:12 | close | 17 | 2.00 | 0.68191 | 0.67650 | 0.00000 | 35.38 | 13708.72 |
| 35 | 2019.12.03 05:37 | buy | 18 | 2.00 | 0.68376 | 0.67856 | 0.00000 | ||
| 36 | 2019.12.03 12:15 | close | 18 | 2.00 | 0.68523 | 0.67856 | 0.00000 | 294.00 | 14002.72 |
| 37 | 2019.12.04 18:00 | sell | 19 | 2.04 | 0.68513 | 0.69033 | 0.00000 | ||
| 38 | 2019.12.05 00:00 | close | 19 | 2.04 | 0.68482 | 0.69033 | 0.00000 | 63.73 | 14066.45 |
| 39 | 2019.12.06 15:30 | sell | 20 | 2.05 | 0.68384 | 0.68904 | 0.00000 | ||
| 40 | 2019.12.06 18:02 | close | 20 | 2.05 | 0.68333 | 0.68904 | 0.00000 | 104.55 | 14171.00 |
| 41 | 2019.12.09 00:00 | sell | 21 | 2.07 | 0.68307 | 0.68827 | 0.00000 | ||
| 42 | 2019.12.09 15:42 | close | 21 | 2.07 | 0.68279 | 0.68827 | 0.00000 | 57.96 | 14228.96 |
| 43 | 2019.12.09 23:56 | sell | 22 | 2.08 | 0.68243 | 0.68763 | 0.00000 | ||
| 44 | 2019.12.10 15:38 | close | 22 | 2.08 | 0.68155 | 0.68763 | 0.00000 | 183.21 | 14412.16 |
| 45 | 2019.12.13 16:23 | sell | 23 | 2.09 | 0.68847 | 0.69367 | 0.00000 | ||
| 46 | 2019.12.13 23:00 | close | 23 | 2.09 | 0.68711 | 0.69367 | 0.00000 | 284.24 | 14696.40 |