Strategy Tester Report
USIndexExpert
FXDD-MT4 Demo Server (Build 1260)
| Symbol | EURUSD (Euro vs. United States Dollar) | ||||
| Period | 30 Minutes (M30) 2019.12.30 00:00 - 2020.04.10 23:30 (2019.12.30 - 2020.04.12) | ||||
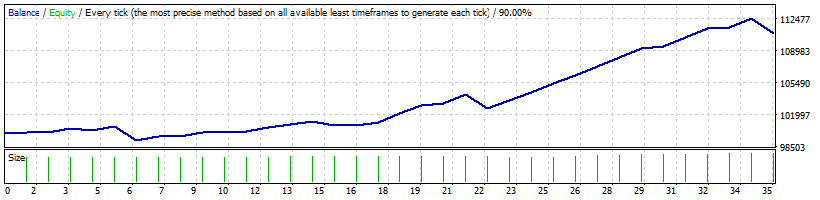
| Model | Every tick (the most precise method based on all available least timeframes) | ||||
| Parameters | TrackPeriod=20; TRRR=1; UpATRR=1; DownATRR=1; DPR=0.5; StopLoss=800; TakeProfit=500; TS=300; MUR=0.02; SOLR=5; CDH=24; BandDeviation=2; BandPeriod=20; MinDeviation=50; OpenFlag=15; PassbyFlag=0; | ||||
| Bars in test | 4549 | Ticks modelled | 11060745 | Modelling quality | 90.00% |
| Mismatched charts errors | 2 | ||||
| Initial deposit | 100000.00 | Spread | 30 | ||
| Total net profit | 10841.30 | Gross profit | 16270.72 | Gross loss | -5429.43 |
| Profit factor | 3.00 | Expected payoff | 309.75 | ||
| Absolute drawdown | 1022.61 | Maximal drawdown | 2134.58 (2.04%) | Relative drawdown | 2.04% (2134.58) |
| Total trades | 35 | Short positions (won %) | 18 (94.44%) | Long positions (won %) | 17 (76.47%) |
| Profit trades (% of total) | 30 (85.71%) | Loss trades (% of total) | 5 (14.29%) | ||
| Largest | profit trade | 1025.00 | loss trade | -1716.20 | |
| Average | profit trade | 542.36 | loss trade | -1085.89 | |
| Maximum | consecutive wins (profit in money) | 12 (9902.66) | consecutive losses (loss in money) | 1 (-1716.20) | |
| Maximal | consecutive profit (count of wins) | 9902.66 (12) | consecutive loss (count of losses) | -1716.20 (1) | |
| Average | consecutive wins | 6 | consecutive losses | 1 | |
| # | Time | Type | Order | Size | Price | S / L | T / P | Profit | Balance |
| 1 | 2020.01.03 09:53 | sell | 1 | 1.79 | 1.11514 | 1.12344 | 1.11014 | ||
| 2 | 2020.01.03 16:20 | close | 1 | 1.79 | 1.11486 | 1.12344 | 1.11014 | 50.12 | 100050.12 |
| 3 | 2020.01.06 11:44 | buy | 2 | 1.78 | 1.11910 | 1.11080 | 1.12410 | ||
| 4 | 2020.01.06 20:56 | close | 2 | 1.78 | 1.11918 | 1.11080 | 1.12410 | 14.24 | 100064.36 |
| 5 | 2020.01.07 09:32 | sell | 3 | 1.79 | 1.11726 | 1.12556 | 1.11226 | ||
| 6 | 2020.01.07 23:31 | close | 3 | 1.79 | 1.11497 | 1.12556 | 1.11226 | 409.91 | 100474.27 |
| 7 | 2020.01.10 19:25 | buy | 4 | 1.80 | 1.11310 | 1.10480 | 1.11810 | ||
| 8 | 2020.01.10 23:00 | close | 4 | 1.80 | 1.11202 | 1.10480 | 1.11810 | -194.40 | 100279.87 |
| 9 | 2020.01.14 14:16 | sell | 5 | 1.80 | 1.11190 | 1.12020 | 1.10690 | ||
| 10 | 2020.01.17 23:00 | close | 5 | 1.80 | 1.10947 | 1.12020 | 1.10690 | 440.16 | 100720.03 |
| 11 | 2020.01.21 12:25 | buy | 6 | 1.81 | 1.11072 | 1.10242 | 1.11572 | ||
| 12 | 2020.01.24 17:34 | s/l | 6 | 1.81 | 1.10242 | 1.10242 | 1.11572 | -1545.74 | 99174.29 |
| 13 | 2020.01.31 16:45 | buy | 7 | 1.79 | 1.10658 | 1.09828 | 1.11158 | ||
| 14 | 2020.01.31 23:00 | close | 7 | 1.79 | 1.10895 | 1.09828 | 1.11158 | 424.23 | 99598.52 |
| 15 | 2020.02.03 16:47 | sell | 8 | 1.80 | 1.10460 | 1.11290 | 1.09960 | ||
| 16 | 2020.02.04 21:26 | close | 8 | 1.80 | 1.10448 | 1.11290 | 1.09960 | 22.15 | 99620.67 |
| 17 | 2020.02.05 11:35 | sell | 9 | 1.80 | 1.10260 | 1.11090 | 1.09760 | ||
| 18 | 2020.02.06 00:30 | close | 9 | 1.80 | 1.10017 | 1.11090 | 1.09760 | 439.05 | 100059.72 |
| 19 | 2020.02.06 17:16 | sell | 10 | 1.82 | 1.09809 | 1.10639 | 1.09309 | ||
| 20 | 2020.02.07 02:03 | close | 10 | 1.82 | 1.09808 | 1.10639 | 1.09309 | 2.38 | 100062.10 |
| 21 | 2020.02.07 10:59 | sell | 11 | 1.82 | 1.09568 | 1.10398 | 1.09068 | ||
| 22 | 2020.02.07 23:00 | close | 11 | 1.82 | 1.09494 | 1.10398 | 1.09068 | 134.68 | 100196.78 |
| 23 | 2020.02.10 15:53 | sell | 12 | 1.83 | 1.09354 | 1.10184 | 1.08854 | ||
| 24 | 2020.02.11 02:45 | close | 12 | 1.83 | 1.09136 | 1.10184 | 1.08854 | 399.50 | 100596.28 |
| 25 | 2020.02.11 15:28 | sell | 13 | 1.84 | 1.08983 | 1.09813 | 1.08483 | ||
| 26 | 2020.02.13 03:11 | close | 13 | 1.84 | 1.08761 | 1.09813 | 1.08483 | 410.74 | 101007.02 |
| 27 | 2020.02.13 13:58 | sell | 14 | 1.86 | 1.08565 | 1.09395 | 1.08065 | ||
| 28 | 2020.02.14 01:50 | close | 14 | 1.86 | 1.08430 | 1.09395 | 1.08065 | 251.67 | 101258.69 |
| 29 | 2020.02.14 15:56 | buy | 15 | 1.86 | 1.08590 | 1.07760 | 1.09090 | ||
| 30 | 2020.02.14 23:00 | close | 15 | 1.86 | 1.08364 | 1.07760 | 1.09090 | -420.36 | 100838.33 |
| 31 | 2020.02.18 15:33 | sell | 16 | 1.86 | 1.08039 | 1.08869 | 1.07539 | ||
| 32 | 2020.02.19 02:54 | close | 16 | 1.86 | 1.08005 | 1.08869 | 1.07539 | 63.81 | 100902.14 |
| 33 | 2020.02.21 16:46 | buy | 17 | 1.86 | 1.08306 | 1.07476 | 1.08806 | ||
| 34 | 2020.02.21 23:00 | close | 17 | 1.86 | 1.08482 | 1.07476 | 1.08806 | 327.36 | 101229.50 |
| 35 | 2020.02.25 18:19 | buy | 18 | 1.86 | 1.08809 | 1.07979 | 1.09309 | ||
| 36 | 2020.02.27 10:07 | t/p | 18 | 1.86 | 1.09309 | 1.07979 | 1.09309 | 894.29 | 102123.78 |
| 37 | 2020.02.27 10:57 | buy | 19 | 1.86 | 1.09488 | 1.08658 | 1.09988 | ||
| 38 | 2020.02.27 17:32 | t/p | 19 | 1.86 | 1.09988 | 1.08658 | 1.09988 | 930.00 | 103053.78 |
| 39 | 2020.02.28 10:18 | buy | 20 | 1.86 | 1.10247 | 1.09417 | 1.10747 | ||
| 40 | 2020.02.28 23:00 | close | 20 | 1.86 | 1.10370 | 1.09417 | 1.10747 | 228.78 | 103282.56 |
| 41 | 2020.03.02 13:56 | buy | 21 | 1.85 | 1.11166 | 1.10336 | 1.11666 | ||
| 42 | 2020.03.02 19:04 | t/p | 21 | 1.85 | 1.11666 | 1.10336 | 1.11666 | 925.00 | 104207.56 |
| 43 | 2020.03.03 17:00 | buy | 22 | 1.86 | 1.11882 | 1.11052 | 1.12382 | ||
| 44 | 2020.03.04 16:10 | s/l | 22 | 1.86 | 1.11052 | 1.11052 | 1.12382 | -1552.73 | 102654.84 |
| 45 | 2020.03.05 11:29 | buy | 23 | 1.83 | 1.11611 | 1.10781 | 1.12111 | ||
| 46 | 2020.03.05 19:52 | t/p | 23 | 1.83 | 1.12111 | 1.10781 | 1.12111 | 915.00 | 103569.84 |
| 47 | 2020.03.06 10:32 | buy | 24 | 1.83 | 1.12704 | 1.11874 | 1.13204 | ||
| 48 | 2020.03.06 12:28 | t/p | 24 | 1.83 | 1.13204 | 1.11874 | 1.13204 | 915.00 | 104484.84 |
| 49 | 2020.03.09 04:49 | buy | 25 | 1.82 | 1.14318 | 1.13488 | 1.14818 | ||
| 50 | 2020.03.09 04:50 | t/p | 25 | 1.82 | 1.14818 | 1.13488 | 1.14818 | 910.00 | 105394.84 |
| 51 | 2020.03.12 17:09 | sell | 26 | 1.88 | 1.11672 | 1.12502 | 1.11172 | ||
| 52 | 2020.03.12 18:12 | t/p | 26 | 1.88 | 1.11172 | 1.12502 | 1.11172 | 940.00 | 106334.84 |
| 53 | 2020.03.17 13:24 | sell | 27 | 1.92 | 1.10670 | 1.11500 | 1.10170 | ||
| 54 | 2020.03.17 14:09 | t/p | 27 | 1.92 | 1.10170 | 1.11500 | 1.10170 | 960.00 | 107294.84 |
| 55 | 2020.03.18 16:48 | sell | 28 | 1.96 | 1.08955 | 1.09785 | 1.08455 | ||
| 56 | 2020.03.18 18:55 | t/p | 28 | 1.96 | 1.08455 | 1.09785 | 1.08455 | 980.00 | 108274.84 |
| 57 | 2020.03.26 03:42 | buy | 29 | 1.98 | 1.09228 | 1.08398 | 1.09728 | ||
| 58 | 2020.03.26 14:18 | t/p | 29 | 1.98 | 1.09728 | 1.08398 | 1.09728 | 990.00 | 109264.84 |
| 59 | 2020.03.26 18:28 | buy | 30 | 1.98 | 1.10200 | 1.09370 | 1.10700 | ||
| 60 | 2020.03.27 03:53 | close | 30 | 1.98 | 1.10311 | 1.09370 | 1.10700 | 210.28 | 109475.11 |
| 61 | 2020.03.31 03:55 | sell | 31 | 1.99 | 1.09832 | 1.10662 | 1.09332 | ||
| 62 | 2020.03.31 14:08 | t/p | 31 | 1.99 | 1.09332 | 1.10662 | 1.09332 | 995.00 | 110470.11 |
| 63 | 2020.04.02 15:57 | sell | 32 | 2.03 | 1.08776 | 1.09606 | 1.08276 | ||
| 64 | 2020.04.02 21:11 | t/p | 32 | 2.03 | 1.08276 | 1.09606 | 1.08276 | 1015.00 | 111485.11 |
| 65 | 2020.04.03 10:26 | sell | 33 | 2.06 | 1.07971 | 1.08801 | 1.07471 | ||
| 66 | 2020.04.03 19:33 | close | 33 | 2.06 | 1.07948 | 1.08801 | 1.07471 | 47.38 | 111532.49 |
| 67 | 2020.04.07 09:57 | buy | 34 | 2.05 | 1.08608 | 1.07778 | 1.09108 | ||
| 68 | 2020.04.07 15:27 | t/p | 34 | 2.05 | 1.09108 | 1.07778 | 1.09108 | 1025.00 | 112557.49 |
| 69 | 2020.04.08 09:04 | sell | 35 | 2.07 | 1.08395 | 1.09225 | 1.07895 | ||
| 70 | 2020.04.09 16:14 | s/l | 35 | 2.07 | 1.09225 | 1.09225 | 1.07895 | -1716.20 | 110841.30 |