Strategy Tester Report
USIndexExpert
FXDD-MT4 Demo Server (Build 1260)
| Symbol | GBPUSD (Great Britain Pound vs. United States Dollar) | ||||
| Period | 1 Hour (H1) 2020.01.06 00:00 - 2020.04.17 23:00 (2020.01.06 - 2020.04.18) | ||||
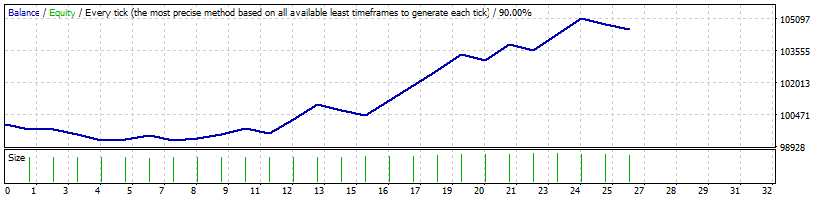
| Model | Every tick (the most precise method based on all available least timeframes) | ||||
| Parameters | TrackPeriod=20; TRRR=2; UpATRR=1; DownATRR=0.5; DPR=0.5; StopLoss=300; TakeProfit=900; TS=300; MUR=0.01; SOLR=5; CDH=24; BandDeviation=2; BandPeriod=20; MinDeviation=50; OpenFlag=15; PassbyFlag=0; | ||||
| Bars in test | 2738 | Ticks modelled | 10383178 | Modelling quality | 90.00% |
| Mismatched charts errors | 1 | ||||
| Initial deposit | 100000.00 | Spread | 30 | ||
| Total net profit | 4575.36 | Gross profit | 7475.64 | Gross loss | -2900.28 |
| Profit factor | 2.58 | Expected payoff | 175.98 | ||
| Absolute drawdown | 875.68 | Maximal drawdown | 1093.04 (1.09%) | Relative drawdown | 1.09% (1093.04) |
| Total trades | 26 | Short positions (won %) | 19 (57.89%) | Long positions (won %) | 7 (57.14%) |
| Profit trades (% of total) | 15 (57.69%) | Loss trades (% of total) | 11 (42.31%) | ||
| Largest | profit trade | 792.00 | loss trade | -290.40 | |
| Average | profit trade | 498.38 | loss trade | -263.66 | |
| Maximum | consecutive wins (profit in money) | 4 (2916.00) | consecutive losses (loss in money) | 2 (-557.70) | |
| Maximal | consecutive profit (count of wins) | 2916.00 (4) | consecutive loss (count of losses) | -557.70 (2) | |
| Average | consecutive wins | 2 | consecutive losses | 1 | |
| # | Time | Type | Order | Size | Price | S / L | T / P | Profit | Balance |
| 1 | 2020.01.09 11:44 | sell | 1 | 0.76 | 1.30439 | 1.30769 | 1.29539 | ||
| 2 | 2020.01.10 06:21 | s/l | 1 | 0.76 | 1.30769 | 1.30769 | 1.29539 | -252.23 | 99747.77 |
| 3 | 2020.01.13 10:21 | sell | 2 | 0.76 | 1.29885 | 1.30215 | 1.28985 | ||
| 4 | 2020.01.14 12:58 | close | 2 | 0.76 | 1.29867 | 1.30215 | 1.28985 | 12.25 | 99760.02 |
| 5 | 2020.01.17 11:19 | buy | 3 | 0.76 | 1.31156 | 1.30826 | 1.32056 | ||
| 6 | 2020.01.17 11:30 | s/l | 3 | 0.76 | 1.30826 | 1.30826 | 1.32056 | -250.80 | 99509.22 |
| 7 | 2020.01.20 11:05 | sell | 4 | 0.76 | 1.29643 | 1.29973 | 1.28743 | ||
| 8 | 2020.01.20 13:15 | s/l | 4 | 0.76 | 1.29973 | 1.29973 | 1.28743 | -250.80 | 99258.42 |
| 9 | 2020.01.28 09:35 | sell | 5 | 0.76 | 1.30239 | 1.30569 | 1.29339 | ||
| 10 | 2020.01.28 22:57 | close | 5 | 0.76 | 1.30212 | 1.30569 | 1.29339 | 20.52 | 99278.94 |
| 11 | 2020.01.31 17:56 | buy | 6 | 0.75 | 1.31779 | 1.31449 | 1.32679 | ||
| 12 | 2020.01.31 23:00 | close | 6 | 0.75 | 1.32041 | 1.31449 | 1.32679 | 196.50 | 99475.44 |
| 13 | 2020.02.04 09:32 | sell | 7 | 0.76 | 1.29563 | 1.29893 | 1.28663 | ||
| 14 | 2020.02.04 10:58 | s/l | 7 | 0.76 | 1.29893 | 1.29893 | 1.28663 | -250.80 | 99224.64 |
| 15 | 2020.02.07 18:28 | sell | 8 | 0.76 | 1.29035 | 1.29365 | 1.28135 | ||
| 16 | 2020.02.07 23:00 | close | 8 | 0.76 | 1.28860 | 1.29365 | 1.28135 | 133.00 | 99357.64 |
| 17 | 2020.02.13 14:16 | buy | 9 | 0.76 | 1.30184 | 1.29854 | 1.31084 | ||
| 18 | 2020.02.14 09:01 | close | 9 | 0.76 | 1.30431 | 1.29854 | 1.31084 | 185.41 | 99543.05 |
| 19 | 2020.02.19 16:12 | sell | 10 | 0.76 | 1.29566 | 1.29896 | 1.28666 | ||
| 20 | 2020.02.20 11:30 | close | 10 | 0.76 | 1.29181 | 1.29896 | 1.28666 | 288.30 | 99831.35 |
| 21 | 2020.02.20 13:15 | sell | 11 | 0.77 | 1.28650 | 1.28980 | 1.27750 | ||
| 22 | 2020.02.21 07:00 | s/l | 11 | 0.77 | 1.28980 | 1.28980 | 1.27750 | -255.55 | 99575.80 |
| 23 | 2020.02.28 16:37 | sell | 12 | 0.77 | 1.28228 | 1.28558 | 1.27328 | ||
| 24 | 2020.02.28 20:35 | t/p | 12 | 0.77 | 1.27328 | 1.28558 | 1.27328 | 693.00 | 100268.80 |
| 25 | 2020.03.05 11:54 | buy | 13 | 0.77 | 1.29245 | 1.28915 | 1.30145 | ||
| 26 | 2020.03.06 13:22 | t/p | 13 | 0.77 | 1.30145 | 1.28915 | 1.30145 | 690.66 | 100959.46 |
| 27 | 2020.03.09 10:18 | buy | 14 | 0.76 | 1.31661 | 1.31331 | 1.32561 | ||
| 28 | 2020.03.09 12:06 | s/l | 14 | 0.76 | 1.31331 | 1.31331 | 1.32561 | -250.80 | 100708.66 |
| 29 | 2020.03.11 10:01 | sell | 15 | 0.78 | 1.28333 | 1.28663 | 1.27433 | ||
| 30 | 2020.03.11 10:02 | s/l | 15 | 0.78 | 1.28663 | 1.28663 | 1.27433 | -257.40 | 100451.26 |
| 31 | 2020.03.12 11:58 | sell | 16 | 0.78 | 1.27663 | 1.27993 | 1.26763 | ||
| 32 | 2020.03.12 15:26 | t/p | 16 | 0.78 | 1.26763 | 1.27993 | 1.26763 | 702.00 | 101153.26 |
| 33 | 2020.03.12 16:48 | sell | 17 | 0.80 | 1.26129 | 1.26459 | 1.25229 | ||
| 34 | 2020.03.12 19:04 | t/p | 17 | 0.80 | 1.25229 | 1.26459 | 1.25229 | 720.00 | 101873.26 |
| 35 | 2020.03.13 18:57 | sell | 18 | 0.82 | 1.24145 | 1.24475 | 1.23245 | ||
| 36 | 2020.03.13 21:08 | t/p | 18 | 0.82 | 1.23245 | 1.24475 | 1.23245 | 738.00 | 102611.26 |
| 37 | 2020.03.17 13:38 | sell | 19 | 0.84 | 1.21349 | 1.21679 | 1.20449 | ||
| 38 | 2020.03.17 17:00 | t/p | 19 | 0.84 | 1.20449 | 1.21679 | 1.20449 | 756.00 | 103367.26 |
| 39 | 2020.03.17 18:57 | sell | 20 | 0.86 | 1.20092 | 1.20422 | 1.19192 | ||
| 40 | 2020.03.17 19:20 | s/l | 20 | 0.86 | 1.20422 | 1.20422 | 1.19192 | -283.80 | 103083.46 |
| 41 | 2020.03.18 14:15 | sell | 21 | 0.86 | 1.19545 | 1.19875 | 1.18645 | ||
| 42 | 2020.03.18 15:21 | t/p | 21 | 0.86 | 1.18645 | 1.19875 | 1.18645 | 774.00 | 103857.46 |
| 43 | 2020.03.18 16:45 | sell | 22 | 0.88 | 1.17755 | 1.18085 | 1.16855 | ||
| 44 | 2020.03.18 16:57 | s/l | 22 | 0.88 | 1.18085 | 1.18085 | 1.16855 | -290.40 | 103567.06 |
| 45 | 2020.03.18 19:35 | sell | 23 | 0.88 | 1.17175 | 1.17505 | 1.16275 | ||
| 46 | 2020.03.18 19:51 | t/p | 23 | 0.88 | 1.16275 | 1.17505 | 1.16275 | 792.00 | 104359.06 |
| 47 | 2020.03.26 18:57 | buy | 24 | 0.86 | 1.21334 | 1.21004 | 1.22234 | ||
| 48 | 2020.03.26 22:57 | t/p | 24 | 0.86 | 1.22234 | 1.21004 | 1.22234 | 774.00 | 105133.06 |
| 49 | 2020.04.07 01:20 | sell | 25 | 0.86 | 1.21731 | 1.22061 | 1.20831 | ||
| 50 | 2020.04.07 01:31 | s/l | 25 | 0.86 | 1.22061 | 1.22061 | 1.20831 | -283.80 | 104849.26 |
| 51 | 2020.04.13 09:48 | buy | 26 | 0.83 | 1.25294 | 1.24964 | 1.26194 | ||
| 52 | 2020.04.13 13:13 | s/l | 26 | 0.83 | 1.24964 | 1.24964 | 1.26194 | -273.90 | 104575.36 |