Strategy Tester Report
USIndexExpert
FXDD-MT4 Demo Server (Build 1260)
| Symbol | GBPUSD (Great Britain Pound vs. United States Dollar) | ||||
| Period | 1 Hour (H1) 2020.01.13 00:00 - 2020.04.24 23:00 (2020.01.13 - 2020.04.26) | ||||
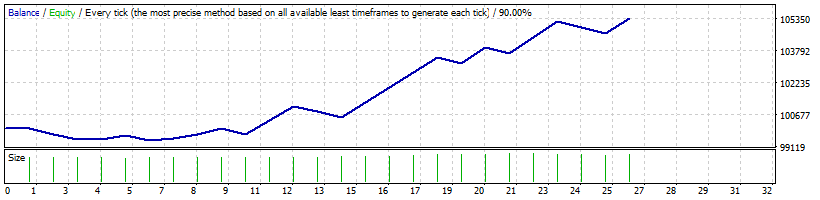
| Model | Every tick (the most precise method based on all available least timeframes) | ||||
| Parameters | TrackPeriod=20; TRRR=2; UpATRR=1; DownATRR=0.5; DPR=0.5; StopLoss=300; TakeProfit=900; TS=300; MaxSpread=50; MUR=0.01; SOLR=5; CDH=24; BandDeviation=2; BandPeriod=20; MinDeviation=50; OpenFlag=15; PassbyFlag=0; | ||||
| Bars in test | 2736 | Ticks modelled | 10525200 | Modelling quality | 90.00% |
| Mismatched charts errors | 1 | ||||
| Initial deposit | 100000.00 | Spread | 50 | ||
| Total net profit | 5385.65 | Gross profit | 8192.60 | Gross loss | -2806.95 |
| Profit factor | 2.92 | Expected payoff | 207.14 | ||
| Absolute drawdown | 698.53 | Maximal drawdown | 930.38 (0.93%) | Relative drawdown | 0.93% (930.38) |
| Total trades | 26 | Short positions (won %) | 19 (63.16%) | Long positions (won %) | 7 (57.14%) |
| Profit trades (% of total) | 16 (61.54%) | Loss trades (% of total) | 10 (38.46%) | ||
| Largest | profit trade | 792.00 | loss trade | -308.00 | |
| Average | profit trade | 512.04 | loss trade | -280.70 | |
| Maximum | consecutive wins (profit in money) | 4 (2916.00) | consecutive losses (loss in money) | 2 (-591.50) | |
| Maximal | consecutive profit (count of wins) | 2916.00 (4) | consecutive loss (count of losses) | -591.50 (2) | |
| Average | consecutive wins | 2 | consecutive losses | 1 | |
| # | Time | Type | Order | Size | Price | S / L | T / P | Profit | Balance |
| 1 | 2020.01.13 10:21 | sell | 1 | 0.76 | 1.29885 | 1.30235 | 1.28985 | ||
| 2 | 2020.01.14 12:58 | close | 1 | 0.76 | 1.29866 | 1.30235 | 1.28985 | 14.49 | 100014.49 |
| 3 | 2020.01.17 11:19 | buy | 2 | 0.76 | 1.31176 | 1.30826 | 1.32076 | ||
| 4 | 2020.01.17 11:30 | s/l | 2 | 0.76 | 1.30826 | 1.30826 | 1.32076 | -266.00 | 99748.49 |
| 5 | 2020.01.20 11:05 | sell | 3 | 0.76 | 1.29643 | 1.29993 | 1.28743 | ||
| 6 | 2020.01.20 13:15 | s/l | 3 | 0.76 | 1.29993 | 1.29993 | 1.28743 | -266.00 | 99482.49 |
| 7 | 2020.01.28 09:35 | sell | 4 | 0.76 | 1.30239 | 1.30589 | 1.29339 | ||
| 8 | 2020.01.28 22:40 | close | 4 | 0.76 | 1.30212 | 1.30589 | 1.29339 | 20.52 | 99503.01 |
| 9 | 2020.01.31 17:56 | buy | 5 | 0.75 | 1.31799 | 1.31449 | 1.32699 | ||
| 10 | 2020.01.31 23:00 | close | 5 | 0.75 | 1.32041 | 1.31449 | 1.32699 | 181.50 | 99684.51 |
| 11 | 2020.02.04 09:32 | sell | 6 | 0.76 | 1.29563 | 1.29913 | 1.28663 | ||
| 12 | 2020.02.04 10:58 | s/l | 6 | 0.76 | 1.29913 | 1.29913 | 1.28663 | -266.00 | 99418.51 |
| 13 | 2020.02.07 18:28 | sell | 7 | 0.77 | 1.29035 | 1.29385 | 1.28135 | ||
| 14 | 2020.02.07 23:00 | close | 7 | 0.77 | 1.28880 | 1.29385 | 1.28135 | 119.35 | 99537.86 |
| 15 | 2020.02.13 14:16 | buy | 8 | 0.76 | 1.30204 | 1.29854 | 1.31104 | ||
| 16 | 2020.02.14 09:01 | close | 8 | 0.76 | 1.30431 | 1.29854 | 1.31104 | 170.03 | 99707.89 |
| 17 | 2020.02.19 16:12 | sell | 9 | 0.76 | 1.29566 | 1.29916 | 1.28666 | ||
| 18 | 2020.02.20 11:30 | close | 9 | 0.76 | 1.29183 | 1.29916 | 1.28666 | 291.22 | 99999.12 |
| 19 | 2020.02.20 13:15 | sell | 10 | 0.77 | 1.28650 | 1.29000 | 1.27750 | ||
| 20 | 2020.02.21 07:00 | s/l | 10 | 0.77 | 1.29000 | 1.29000 | 1.27750 | -269.45 | 99729.67 |
| 21 | 2020.02.28 16:37 | sell | 11 | 0.77 | 1.28228 | 1.28578 | 1.27328 | ||
| 22 | 2020.02.28 20:36 | t/p | 11 | 0.77 | 1.27328 | 1.28578 | 1.27328 | 693.00 | 100422.67 |
| 23 | 2020.03.05 11:54 | buy | 12 | 0.77 | 1.29265 | 1.28915 | 1.30165 | ||
| 24 | 2020.03.06 13:23 | t/p | 12 | 0.77 | 1.30165 | 1.28915 | 1.30165 | 690.48 | 101113.15 |
| 25 | 2020.03.09 10:18 | buy | 13 | 0.76 | 1.31681 | 1.31331 | 1.32581 | ||
| 26 | 2020.03.09 12:06 | s/l | 13 | 0.76 | 1.31331 | 1.31331 | 1.32581 | -266.00 | 100847.15 |
| 27 | 2020.03.11 10:01 | sell | 14 | 0.78 | 1.28333 | 1.28683 | 1.27433 | ||
| 28 | 2020.03.11 10:02 | s/l | 14 | 0.78 | 1.28683 | 1.28683 | 1.27433 | -273.00 | 100574.15 |
| 29 | 2020.03.12 11:58 | sell | 15 | 0.78 | 1.27663 | 1.28013 | 1.26763 | ||
| 30 | 2020.03.12 15:26 | t/p | 15 | 0.78 | 1.26763 | 1.28013 | 1.26763 | 702.00 | 101276.15 |
| 31 | 2020.03.12 16:48 | sell | 16 | 0.80 | 1.26129 | 1.26479 | 1.25229 | ||
| 32 | 2020.03.12 19:04 | t/p | 16 | 0.80 | 1.25229 | 1.26479 | 1.25229 | 720.00 | 101996.15 |
| 33 | 2020.03.13 18:57 | sell | 17 | 0.82 | 1.24145 | 1.24495 | 1.23245 | ||
| 34 | 2020.03.13 21:19 | t/p | 17 | 0.82 | 1.23245 | 1.24495 | 1.23245 | 738.00 | 102734.15 |
| 35 | 2020.03.17 13:38 | sell | 18 | 0.84 | 1.21349 | 1.21699 | 1.20449 | ||
| 36 | 2020.03.17 17:01 | t/p | 18 | 0.84 | 1.20449 | 1.21699 | 1.20449 | 756.00 | 103490.15 |
| 37 | 2020.03.17 18:57 | sell | 19 | 0.86 | 1.20092 | 1.20442 | 1.19192 | ||
| 38 | 2020.03.17 19:20 | s/l | 19 | 0.86 | 1.20442 | 1.20442 | 1.19192 | -301.00 | 103189.15 |
| 39 | 2020.03.18 14:15 | sell | 20 | 0.86 | 1.19545 | 1.19895 | 1.18645 | ||
| 40 | 2020.03.18 15:21 | t/p | 20 | 0.86 | 1.18645 | 1.19895 | 1.18645 | 774.00 | 103963.15 |
| 41 | 2020.03.18 16:45 | sell | 21 | 0.88 | 1.17755 | 1.18105 | 1.16855 | ||
| 42 | 2020.03.18 16:57 | s/l | 21 | 0.88 | 1.18105 | 1.18105 | 1.16855 | -308.00 | 103655.15 |
| 43 | 2020.03.18 19:35 | sell | 22 | 0.88 | 1.17175 | 1.17525 | 1.16275 | ||
| 44 | 2020.03.18 19:51 | t/p | 22 | 0.88 | 1.16275 | 1.17525 | 1.16275 | 792.00 | 104447.15 |
| 45 | 2020.03.26 18:57 | buy | 23 | 0.86 | 1.21354 | 1.21004 | 1.22254 | ||
| 46 | 2020.03.26 22:58 | t/p | 23 | 0.86 | 1.22254 | 1.21004 | 1.22254 | 774.00 | 105221.15 |
| 47 | 2020.04.07 01:20 | sell | 24 | 0.86 | 1.21731 | 1.22081 | 1.20831 | ||
| 48 | 2020.04.07 01:31 | s/l | 24 | 0.86 | 1.22081 | 1.22081 | 1.20831 | -301.00 | 104920.15 |
| 49 | 2020.04.13 09:48 | buy | 25 | 0.83 | 1.25314 | 1.24964 | 1.26214 | ||
| 50 | 2020.04.13 13:13 | s/l | 25 | 0.83 | 1.24964 | 1.24964 | 1.26214 | -290.50 | 104629.65 |
| 51 | 2020.04.21 12:24 | sell | 26 | 0.84 | 1.23558 | 1.23908 | 1.22658 | ||
| 52 | 2020.04.21 18:59 | t/p | 26 | 0.84 | 1.22658 | 1.23908 | 1.22658 | 756.00 | 105385.65 |