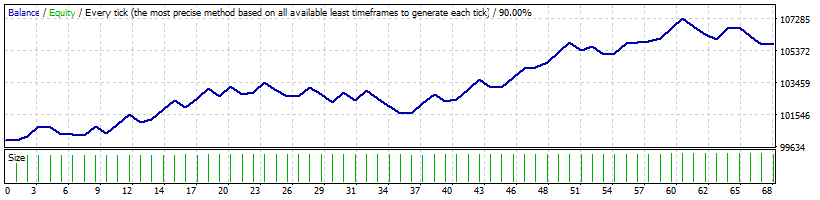
Strategy Tester Report
USIndexExpert
FXDD-MT4 Demo Server (Build 1260)
| Symbol | USDCAD (United States Dollar vs. Canadian Dollar) | ||||
| Period | 30 Minutes (M30) 2020.02.24 00:00 - 2020.06.05 23:30 (2020.02.24 - 2020.06.06) | ||||
| Model | Every tick (the most precise method based on all available least timeframes) | ||||
| Parameters | TrackPeriod=15; TRRR=0.5; UpATRR=0.5; DownATRR=1; DPR=0.5; StopLoss=600; TakeProfit=800; TS=300; MaxSpread=30; MUR=0.01; SOLR=5; CDH=24; BandDeviation=2; BandPeriod=20; MinDeviation=50; OpenFlag=15; PassbyFlag=0; | ||||
| Bars in test | 4600 | Ticks modelled | 9337516 | Modelling quality | 90.00% |
| Mismatched charts errors | 1 | ||||
| Initial deposit | 100000.00 | Spread | 30 | ||
| Total net profit | 5757.18 | Gross profit | 16257.69 | Gross loss | -10500.51 |
| Profit factor | 1.55 | Expected payoff | 84.66 | ||
| Absolute drawdown | 238.90 | Maximal drawdown | 2153.31 (2.08%) | Relative drawdown | 2.08% (2153.31) |
| Total trades | 68 | Short positions (won %) | 25 (64.00%) | Long positions (won %) | 43 (60.47%) |
| Profit trades (% of total) | 42 (61.76%) | Loss trades (% of total) | 26 (38.24%) | ||
| Largest | profit trade | 625.16 | loss trade | -503.15 | |
| Average | profit trade | 387.09 | loss trade | -403.87 | |
| Maximum | consecutive wins (profit in money) | 7 (2722.48) | consecutive losses (loss in money) | 4 (-548.38) | |
| Maximal | consecutive profit (count of wins) | 2722.48 (7) | consecutive loss (count of losses) | -1375.63 (3) | |
| Average | consecutive wins | 2 | consecutive losses | 2 | |
| # | Time | Type | Order | Size | Price | S / L | T / P | Profit | Balance |
| 1 | 2020.02.24 09:14 | buy | 1 | 1.00 | 1.32796 | 1.32166 | 1.33596 | ||
| 2 | 2020.02.24 16:27 | close | 1 | 1.00 | 1.32825 | 1.32166 | 1.33596 | 21.83 | 100021.83 |
| 3 | 2020.02.26 11:04 | buy | 2 | 1.00 | 1.33052 | 1.32422 | 1.33852 | ||
| 4 | 2020.02.27 08:36 | close | 2 | 1.00 | 1.33364 | 1.32422 | 1.33852 | 231.69 | 100253.52 |
| 5 | 2020.02.27 14:30 | buy | 3 | 1.00 | 1.33564 | 1.32934 | 1.34364 | ||
| 6 | 2020.02.28 05:19 | t/p | 3 | 1.00 | 1.34364 | 1.32934 | 1.34364 | 588.62 | 100842.14 |
| 7 | 2020.02.28 06:30 | sell | 4 | 1.00 | 1.34403 | 1.34676 | 0.00000 | ||
| 8 | 2020.02.28 13:35 | close | 4 | 1.00 | 1.34429 | 1.34676 | 0.00000 | -19.34 | 100822.80 |
| 9 | 2020.02.28 14:10 | buy | 5 | 1.00 | 1.34657 | 1.34027 | 1.35457 | ||
| 10 | 2020.02.28 18:32 | s/l | 5 | 1.00 | 1.34027 | 1.34027 | 1.35457 | -470.05 | 100352.75 |
| 11 | 2020.03.04 17:00 | buy | 6 | 1.00 | 1.33869 | 1.33239 | 1.34669 | ||
| 12 | 2020.03.05 00:15 | close | 6 | 1.00 | 1.33870 | 1.33239 | 1.34669 | -1.51 | 100351.23 |
| 13 | 2020.03.05 13:56 | buy | 7 | 1.00 | 1.34200 | 1.33570 | 1.35000 | ||
| 14 | 2020.03.06 23:00 | close | 7 | 1.00 | 1.34132 | 1.33570 | 1.35000 | -57.48 | 100293.75 |
| 15 | 2020.03.09 04:42 | buy | 8 | 1.00 | 1.36470 | 1.35840 | 1.37270 | ||
| 16 | 2020.03.09 04:50 | t/p | 8 | 1.00 | 1.37270 | 1.35840 | 1.37270 | 582.77 | 100876.52 |
| 17 | 2020.03.09 17:37 | sell | 9 | 1.00 | 1.35199 | 1.35829 | 1.34399 | ||
| 18 | 2020.03.09 19:29 | s/l | 9 | 1.00 | 1.35829 | 1.35829 | 1.34399 | -463.81 | 100412.71 |
| 19 | 2020.03.10 17:19 | buy | 10 | 1.00 | 1.37007 | 1.36377 | 1.37807 | ||
| 20 | 2020.03.10 18:34 | t/p | 10 | 1.00 | 1.37807 | 1.36377 | 1.37807 | 580.51 | 100993.22 |
| 21 | 2020.03.12 04:28 | buy | 11 | 1.00 | 1.38117 | 1.37487 | 1.38917 | ||
| 22 | 2020.03.12 19:14 | t/p | 11 | 1.00 | 1.38917 | 1.37487 | 1.38917 | 575.87 | 101569.09 |
| 23 | 2020.03.13 18:57 | buy | 12 | 1.01 | 1.39695 | 1.39065 | 1.40495 | ||
| 24 | 2020.03.13 20:21 | s/l | 12 | 1.01 | 1.39065 | 1.39065 | 1.40495 | -457.56 | 101111.53 |
| 25 | 2020.03.16 16:25 | buy | 13 | 1.01 | 1.39636 | 1.39006 | 1.40436 | ||
| 26 | 2020.03.17 04:00 | close | 13 | 1.01 | 1.39902 | 1.39006 | 1.40436 | 189.75 | 101301.28 |
| 27 | 2020.03.17 11:41 | buy | 14 | 1.01 | 1.40339 | 1.39709 | 1.41139 | ||
| 28 | 2020.03.17 14:14 | t/p | 14 | 1.01 | 1.41139 | 1.39709 | 1.41139 | 572.48 | 101873.76 |
| 29 | 2020.03.17 14:52 | buy | 15 | 1.01 | 1.41420 | 1.40790 | 1.42220 | ||
| 30 | 2020.03.17 19:36 | t/p | 15 | 1.01 | 1.42220 | 1.40790 | 1.42220 | 568.13 | 102441.89 |
| 31 | 2020.03.17 22:26 | buy | 16 | 1.02 | 1.42691 | 1.42061 | 1.43491 | ||
| 32 | 2020.03.17 23:36 | s/l | 16 | 1.02 | 1.42061 | 1.42061 | 1.43491 | -452.34 | 101989.55 |
| 33 | 2020.03.18 11:56 | buy | 17 | 1.01 | 1.42941 | 1.42311 | 1.43741 | ||
| 34 | 2020.03.18 15:18 | t/p | 17 | 1.01 | 1.43741 | 1.42311 | 1.43741 | 562.12 | 102551.67 |
| 35 | 2020.03.18 16:17 | buy | 18 | 1.02 | 1.44282 | 1.43652 | 1.45082 | ||
| 36 | 2020.03.18 17:59 | t/p | 18 | 1.02 | 1.45082 | 1.43652 | 1.45082 | 562.44 | 103114.11 |
| 37 | 2020.03.18 19:58 | buy | 19 | 1.03 | 1.45883 | 1.45253 | 1.46683 | ||
| 38 | 2020.03.18 21:44 | s/l | 19 | 1.03 | 1.45253 | 1.45253 | 1.46683 | -446.74 | 102667.37 |
| 39 | 2020.03.20 09:42 | sell | 20 | 1.02 | 1.43200 | 1.43830 | 1.42400 | ||
| 40 | 2020.03.20 10:53 | t/p | 20 | 1.02 | 1.42400 | 1.43830 | 1.42400 | 573.03 | 103240.40 |
| 41 | 2020.03.25 08:59 | sell | 21 | 1.03 | 1.43403 | 1.44033 | 1.42603 | ||
| 42 | 2020.03.25 13:58 | s/l | 21 | 1.03 | 1.44033 | 1.44033 | 1.42603 | -450.52 | 102789.88 |
| 43 | 2020.03.25 20:22 | sell | 22 | 1.02 | 1.42444 | 1.43074 | 1.41644 | ||
| 44 | 2020.03.26 04:01 | close | 22 | 1.02 | 1.42295 | 1.43074 | 1.41644 | 106.82 | 102896.70 |
| 45 | 2020.03.26 13:34 | sell | 23 | 1.02 | 1.41307 | 1.41937 | 1.40507 | ||
| 46 | 2020.03.26 18:19 | t/p | 23 | 1.02 | 1.40507 | 1.41937 | 1.40507 | 580.75 | 103477.45 |
| 47 | 2020.03.27 15:47 | buy | 24 | 1.03 | 1.41244 | 1.40614 | 1.42044 | ||
| 48 | 2020.03.27 18:26 | s/l | 24 | 1.03 | 1.40614 | 1.40614 | 1.42044 | -461.48 | 103015.97 |
| 49 | 2020.03.27 21:58 | sell | 25 | 1.03 | 1.39410 | 1.40040 | 1.38610 | ||
| 50 | 2020.03.27 23:00 | close | 25 | 1.03 | 1.39925 | 1.40040 | 1.38610 | -379.10 | 102636.87 |
| 51 | 2020.03.30 14:25 | buy | 26 | 1.02 | 1.41490 | 1.40860 | 1.42290 | ||
| 52 | 2020.03.30 22:44 | close | 26 | 1.02 | 1.41491 | 1.40860 | 1.42290 | 0.72 | 102637.59 |
| 53 | 2020.03.31 12:45 | buy | 27 | 1.02 | 1.42239 | 1.41609 | 1.43039 | ||
| 54 | 2020.03.31 16:53 | t/p | 27 | 1.02 | 1.43039 | 1.41609 | 1.43039 | 570.47 | 103208.06 |
| 55 | 2020.03.31 18:39 | sell | 28 | 1.03 | 1.41153 | 1.41783 | 1.40353 | ||
| 56 | 2020.03.31 19:38 | s/l | 28 | 1.03 | 1.41783 | 1.41783 | 1.40353 | -457.67 | 102750.39 |
| 57 | 2020.04.01 12:57 | buy | 29 | 1.02 | 1.42537 | 1.41907 | 1.43337 | ||
| 58 | 2020.04.01 16:24 | s/l | 29 | 1.02 | 1.41907 | 1.41907 | 1.43337 | -452.84 | 102297.55 |
| 59 | 2020.04.02 15:42 | buy | 30 | 1.02 | 1.42134 | 1.41504 | 1.42934 | ||
| 60 | 2020.04.02 16:14 | t/p | 30 | 1.02 | 1.42934 | 1.41504 | 1.42934 | 570.89 | 102868.44 |
| 61 | 2020.04.03 13:21 | buy | 31 | 1.02 | 1.42261 | 1.41631 | 1.43061 | ||
| 62 | 2020.04.03 14:56 | s/l | 31 | 1.02 | 1.41631 | 1.41631 | 1.43061 | -453.72 | 102414.72 |
| 63 | 2020.04.07 07:58 | sell | 32 | 1.02 | 1.40542 | 1.41172 | 1.39742 | ||
| 64 | 2020.04.07 15:49 | t/p | 32 | 1.02 | 1.39742 | 1.41172 | 1.39742 | 583.94 | 102998.66 |
| 65 | 2020.04.08 09:08 | buy | 33 | 1.02 | 1.40636 | 1.40006 | 1.41436 | ||
| 66 | 2020.04.08 14:08 | s/l | 33 | 1.02 | 1.40006 | 1.40006 | 1.41436 | -458.98 | 102539.68 |
| 67 | 2020.04.09 14:29 | buy | 34 | 1.02 | 1.40671 | 1.40041 | 1.41471 | ||
| 68 | 2020.04.09 15:57 | s/l | 34 | 1.02 | 1.40041 | 1.40041 | 1.41471 | -458.87 | 102080.81 |
| 69 | 2020.04.09 16:18 | sell | 35 | 1.02 | 1.39740 | 1.40370 | 1.38940 | ||
| 70 | 2020.04.09 21:54 | s/l | 35 | 1.02 | 1.40370 | 1.40370 | 1.38940 | -457.78 | 101623.03 |
| 71 | 2020.04.13 20:39 | sell | 36 | 1.01 | 1.38973 | 1.39603 | 1.38173 | ||
| 72 | 2020.04.14 04:00 | close | 36 | 1.01 | 1.38959 | 1.39603 | 1.38173 | 10.19 | 101633.22 |
| 73 | 2020.04.15 09:11 | buy | 37 | 1.01 | 1.39313 | 1.38683 | 1.40113 | ||
| 74 | 2020.04.15 11:45 | t/p | 37 | 1.01 | 1.40113 | 1.38683 | 1.40113 | 576.68 | 102209.90 |
| 75 | 2020.04.15 12:55 | buy | 38 | 1.02 | 1.40299 | 1.39669 | 1.41099 | ||
| 76 | 2020.04.15 15:56 | t/p | 38 | 1.02 | 1.41099 | 1.39669 | 1.41099 | 578.32 | 102788.22 |
| 77 | 2020.04.16 19:17 | buy | 39 | 1.02 | 1.41704 | 1.41074 | 1.42504 | ||
| 78 | 2020.04.16 22:37 | s/l | 39 | 1.02 | 1.41074 | 1.41074 | 1.42504 | -455.51 | 102332.71 |
| 79 | 2020.04.20 08:39 | buy | 40 | 1.02 | 1.40918 | 1.40288 | 1.41718 | ||
| 80 | 2020.04.21 04:24 | close | 40 | 1.02 | 1.41129 | 1.40288 | 1.41718 | 150.19 | 102482.91 |
| 81 | 2020.04.21 05:42 | buy | 41 | 1.02 | 1.41774 | 1.41144 | 1.42574 | ||
| 82 | 2020.04.21 13:20 | t/p | 41 | 1.02 | 1.42574 | 1.41144 | 1.42574 | 572.33 | 103055.24 |
| 83 | 2020.04.23 15:53 | sell | 42 | 1.03 | 1.40899 | 1.41529 | 1.40099 | ||
| 84 | 2020.04.23 18:26 | t/p | 42 | 1.03 | 1.40099 | 1.41529 | 1.40099 | 588.16 | 103643.40 |
| 85 | 2020.04.24 09:10 | buy | 43 | 1.03 | 1.41105 | 1.40475 | 1.41905 | ||
| 86 | 2020.04.24 13:51 | s/l | 43 | 1.03 | 1.40475 | 1.40475 | 1.41905 | -461.93 | 103181.47 |
| 87 | 2020.04.28 12:19 | sell | 44 | 1.03 | 1.39858 | 1.40488 | 1.39058 | ||
| 88 | 2020.04.28 20:25 | close | 44 | 1.03 | 1.39857 | 1.40488 | 1.39058 | 0.74 | 103182.21 |
| 89 | 2020.04.30 16:08 | buy | 45 | 1.03 | 1.39095 | 1.38465 | 1.39895 | ||
| 90 | 2020.05.01 04:48 | t/p | 45 | 1.03 | 1.39895 | 1.38465 | 1.39895 | 582.02 | 103764.23 |
| 91 | 2020.05.01 08:49 | buy | 46 | 1.03 | 1.40224 | 1.39594 | 1.41024 | ||
| 92 | 2020.05.01 18:56 | t/p | 46 | 1.03 | 1.41024 | 1.39594 | 1.41024 | 584.30 | 104348.53 |
| 93 | 2020.05.04 15:27 | sell | 47 | 1.04 | 1.40518 | 1.41148 | 1.39718 | ||
| 94 | 2020.05.05 17:32 | close | 47 | 1.04 | 1.40481 | 1.41148 | 1.39718 | 27.40 | 104375.93 |
| 95 | 2020.05.06 15:18 | buy | 48 | 1.04 | 1.40969 | 1.40339 | 1.41769 | ||
| 96 | 2020.05.07 03:44 | close | 48 | 1.04 | 1.41425 | 1.40339 | 1.41769 | 332.98 | 104708.91 |
| 97 | 2020.05.07 17:28 | sell | 49 | 1.04 | 1.40281 | 1.40911 | 1.39481 | ||
| 98 | 2020.05.08 03:41 | t/p | 49 | 1.04 | 1.39481 | 1.40911 | 1.39481 | 596.54 | 105305.45 |
| 99 | 2020.05.11 11:34 | buy | 50 | 1.05 | 1.39553 | 1.38923 | 1.40353 | ||
| 100 | 2020.05.11 18:06 | t/p | 50 | 1.05 | 1.40353 | 1.38923 | 1.40353 | 598.49 | 105903.94 |
| 101 | 2020.05.12 03:29 | buy | 51 | 1.05 | 1.40560 | 1.39930 | 1.41360 | ||
| 102 | 2020.05.12 13:17 | s/l | 51 | 1.05 | 1.39930 | 1.39930 | 1.41360 | -472.74 | 105431.20 |
| 103 | 2020.05.12 22:58 | buy | 52 | 1.05 | 1.40653 | 1.40023 | 1.41453 | ||
| 104 | 2020.05.14 02:31 | close | 52 | 1.05 | 1.40902 | 1.40023 | 1.41453 | 180.80 | 105612.00 |
| 105 | 2020.05.14 12:59 | sell | 53 | 1.05 | 1.40688 | 1.41318 | 1.39888 | ||
| 106 | 2020.05.14 16:49 | s/l | 53 | 1.05 | 1.41318 | 1.41318 | 1.39888 | -468.09 | 105143.91 |
| 107 | 2020.05.15 14:04 | buy | 54 | 1.05 | 1.40886 | 1.40256 | 1.41686 | ||
| 108 | 2020.05.15 23:00 | close | 54 | 1.05 | 1.40976 | 1.40256 | 1.41686 | 67.03 | 105210.94 |
| 109 | 2020.05.18 14:46 | sell | 55 | 1.05 | 1.40430 | 1.41060 | 1.39630 | ||
| 110 | 2020.05.18 19:16 | t/p | 55 | 1.05 | 1.39630 | 1.41060 | 1.39630 | 601.59 | 105812.53 |
| 111 | 2020.05.19 09:58 | sell | 56 | 1.05 | 1.39079 | 1.39709 | 1.38279 | ||
| 112 | 2020.05.19 22:20 | close | 56 | 1.05 | 1.38996 | 1.39709 | 1.38279 | 62.70 | 105875.23 |
| 113 | 2020.05.21 04:04 | buy | 57 | 1.05 | 1.39356 | 1.38726 | 1.40156 | ||
| 114 | 2020.05.22 02:51 | close | 57 | 1.05 | 1.39457 | 1.38726 | 1.40156 | 68.92 | 105944.15 |
| 115 | 2020.05.22 05:16 | buy | 58 | 1.05 | 1.39831 | 1.39201 | 1.40631 | ||
| 116 | 2020.05.22 14:09 | close | 58 | 1.05 | 1.40040 | 1.39201 | 1.40631 | 156.71 | 106100.86 |
| 117 | 2020.05.26 03:47 | sell | 59 | 1.06 | 1.39547 | 1.40177 | 1.38747 | ||
| 118 | 2020.05.26 13:18 | t/p | 59 | 1.06 | 1.38747 | 1.40177 | 1.38747 | 611.19 | 106712.05 |
| 119 | 2020.05.26 14:53 | sell | 60 | 1.06 | 1.38437 | 1.39067 | 1.37637 | ||
| 120 | 2020.05.26 21:56 | t/p | 60 | 1.06 | 1.37637 | 1.39067 | 1.37637 | 616.12 | 107328.17 |
| 121 | 2020.05.27 12:55 | sell | 61 | 1.07 | 1.37345 | 1.37975 | 1.36545 | ||
| 122 | 2020.05.27 16:52 | s/l | 61 | 1.07 | 1.37975 | 1.37975 | 1.36545 | -488.57 | 106839.60 |
| 123 | 2020.05.29 15:08 | sell | 62 | 1.06 | 1.37160 | 1.37790 | 1.36360 | ||
| 124 | 2020.05.29 16:22 | s/l | 62 | 1.06 | 1.37790 | 1.37790 | 1.36360 | -484.65 | 106354.95 |
| 125 | 2020.05.29 17:55 | buy | 63 | 1.06 | 1.38057 | 1.37427 | 1.38857 | ||
| 126 | 2020.05.29 23:00 | close | 63 | 1.06 | 1.37705 | 1.37427 | 1.38857 | -270.96 | 106083.99 |
| 127 | 2020.06.01 17:26 | sell | 64 | 1.06 | 1.36445 | 1.37075 | 1.35645 | ||
| 128 | 2020.06.01 22:22 | t/p | 64 | 1.06 | 1.35645 | 1.37075 | 1.35645 | 625.16 | 106709.15 |
| 129 | 2020.06.02 11:24 | sell | 65 | 1.06 | 1.35123 | 1.35753 | 1.34323 | ||
| 130 | 2020.06.03 09:54 | close | 65 | 1.06 | 1.35068 | 1.35753 | 1.34323 | 43.17 | 106752.32 |
| 131 | 2020.06.03 13:53 | buy | 66 | 1.06 | 1.35508 | 1.34878 | 1.36308 | ||
| 132 | 2020.06.03 17:02 | s/l | 66 | 1.06 | 1.34878 | 1.34878 | 1.36308 | -495.11 | 106257.21 |
| 133 | 2020.06.04 09:47 | buy | 67 | 1.06 | 1.35278 | 1.34648 | 1.36078 | ||
| 134 | 2020.06.05 10:43 | s/l | 67 | 1.06 | 1.34648 | 1.34648 | 1.36078 | -503.15 | 105754.06 |
| 135 | 2020.06.05 14:49 | sell | 68 | 1.05 | 1.34415 | 1.35045 | 1.33615 | ||
| 136 | 2020.06.05 22:07 | close | 68 | 1.05 | 1.34411 | 1.35045 | 1.33615 | 3.12 | 105757.18 |