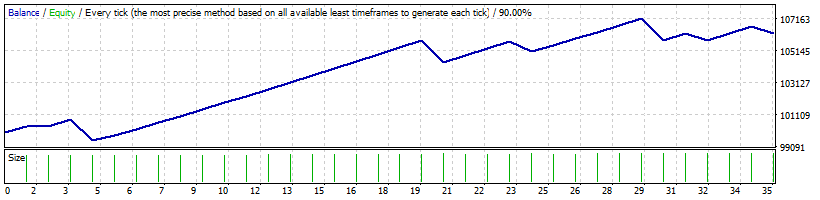
Strategy Tester Report
USIndexExpert
FXDD-MT4 Demo Server (Build 1260)
| Symbol | USDCHF (United States Dollar vs. Swiss Franc) | ||||
| Period | 1 Hour (H1) 2020.01.27 00:00 - 2020.05.08 23:00 (2020.01.27 - 2020.05.09) | ||||
| Model | Every tick (the most precise method based on all available least timeframes) | ||||
| Parameters | TrackPeriod=20; TRRR=1; UpATRR=1; DownATRR=1; DPR=0.5; StopLoss=600; TakeProfit=200; TS=300; MaxSpread=30; MUR=0.02; SOLR=5; CDH=24; BandDeviation=2; BandPeriod=20; MinDeviation=50; OpenFlag=15; PassbyFlag=1; | ||||
| Bars in test | 2808 | Ticks modelled | 8694979 | Modelling quality | 90.00% |
| Mismatched charts errors | 1 | ||||
| Initial deposit | 100000.00 | Spread | 30 | ||
| Total net profit | 6239.60 | Gross profit | 11877.68 | Gross loss | -5638.07 |
| Profit factor | 2.11 | Expected payoff | 178.27 | ||
| Absolute drawdown | 1662.58 | Maximal drawdown | 2472.10 (2.45%) | Relative drawdown | 2.45% (2472.10) |
| Total trades | 35 | Short positions (won %) | 20 (80.00%) | Long positions (won %) | 15 (80.00%) |
| Profit trades (% of total) | 28 (80.00%) | Loss trades (% of total) | 7 (20.00%) | ||
| Largest | profit trade | 447.17 | loss trade | -1387.41 | |
| Average | profit trade | 424.20 | loss trade | -805.44 | |
| Maximum | consecutive wins (profit in money) | 15 (6322.24) | consecutive losses (loss in money) | 1 (-1387.41) | |
| Maximal | consecutive profit (count of wins) | 6322.24 (15) | consecutive loss (count of losses) | -1387.41 (1) | |
| Average | consecutive wins | 4 | consecutive losses | 1 | |
| # | Time | Type | Order | Size | Price | S / L | T / P | Profit | Balance |
| 1 | 2020.01.31 15:16 | sell | 1 | 2.00 | 0.96727 | 0.97357 | 0.96527 | ||
| 2 | 2020.01.31 16:51 | t/p | 1 | 2.00 | 0.96527 | 0.97357 | 0.96527 | 414.39 | 100414.39 |
| 3 | 2020.01.31 18:23 | sell | 2 | 2.00 | 0.96324 | 0.96954 | 0.96124 | ||
| 4 | 2020.01.31 23:00 | close | 2 | 2.00 | 0.96332 | 0.96954 | 0.96124 | -16.61 | 100397.78 |
| 5 | 2020.02.04 10:27 | buy | 3 | 2.00 | 0.96962 | 0.96332 | 0.97162 | ||
| 6 | 2020.02.05 11:35 | t/p | 3 | 2.00 | 0.97162 | 0.96332 | 0.97162 | 411.74 | 100809.52 |
| 7 | 2020.02.12 11:55 | sell | 4 | 2.01 | 0.97417 | 0.98047 | 0.97217 | ||
| 8 | 2020.02.14 08:49 | s/l | 4 | 2.01 | 0.98047 | 0.98047 | 0.97217 | -1332.37 | 99477.15 |
| 9 | 2020.02.18 09:52 | sell | 5 | 1.98 | 0.97959 | 0.98589 | 0.97759 | ||
| 10 | 2020.02.21 17:17 | t/p | 5 | 1.98 | 0.97759 | 0.98589 | 0.97759 | 354.78 | 99831.93 |
| 11 | 2020.02.26 10:48 | sell | 6 | 1.99 | 0.97387 | 0.98017 | 0.97187 | ||
| 12 | 2020.02.27 10:31 | t/p | 6 | 1.99 | 0.97187 | 0.98017 | 0.97187 | 379.19 | 100211.12 |
| 13 | 2020.02.27 14:46 | sell | 7 | 2.00 | 0.96913 | 0.97543 | 0.96713 | ||
| 14 | 2020.02.28 07:49 | t/p | 7 | 2.00 | 0.96713 | 0.97543 | 0.96713 | 403.43 | 100614.55 |
| 15 | 2020.02.28 10:28 | sell | 8 | 2.01 | 0.96492 | 0.97122 | 0.96292 | ||
| 16 | 2020.02.28 11:08 | t/p | 8 | 2.01 | 0.96292 | 0.97122 | 0.96292 | 417.48 | 101032.03 |
| 17 | 2020.03.02 13:51 | sell | 9 | 2.02 | 0.95820 | 0.96450 | 0.95620 | ||
| 18 | 2020.03.02 15:36 | t/p | 9 | 2.02 | 0.95620 | 0.96450 | 0.95620 | 422.51 | 101454.54 |
| 19 | 2020.03.03 17:11 | sell | 10 | 2.02 | 0.95415 | 0.96045 | 0.95215 | ||
| 20 | 2020.03.03 17:19 | t/p | 10 | 2.02 | 0.95215 | 0.96045 | 0.95215 | 424.30 | 101878.84 |
| 21 | 2020.03.05 11:28 | sell | 11 | 2.03 | 0.95378 | 0.96008 | 0.95178 | ||
| 22 | 2020.03.05 14:19 | t/p | 11 | 2.03 | 0.95178 | 0.96008 | 0.95178 | 426.57 | 102305.41 |
| 23 | 2020.03.06 10:32 | sell | 12 | 2.04 | 0.94160 | 0.94790 | 0.93960 | ||
| 24 | 2020.03.06 11:40 | t/p | 12 | 2.04 | 0.93960 | 0.94790 | 0.93960 | 434.23 | 102739.64 |
| 25 | 2020.03.06 12:25 | sell | 13 | 2.05 | 0.93690 | 0.94320 | 0.93490 | ||
| 26 | 2020.03.06 15:05 | t/p | 13 | 2.05 | 0.93490 | 0.94320 | 0.93490 | 438.56 | 103178.20 |
| 27 | 2020.03.09 04:49 | sell | 14 | 2.06 | 0.92335 | 0.92965 | 0.92135 | ||
| 28 | 2020.03.09 04:49 | t/p | 14 | 2.06 | 0.92135 | 0.92965 | 0.92135 | 447.17 | 103625.37 |
| 29 | 2020.03.12 17:10 | buy | 15 | 2.07 | 0.94491 | 0.93861 | 0.94691 | ||
| 30 | 2020.03.12 17:10 | t/p | 15 | 2.07 | 0.94691 | 0.93861 | 0.94691 | 437.21 | 104062.58 |
| 31 | 2020.03.12 18:55 | buy | 16 | 2.08 | 0.95246 | 0.94616 | 0.95446 | ||
| 32 | 2020.03.12 19:03 | t/p | 16 | 2.08 | 0.95446 | 0.94616 | 0.95446 | 435.85 | 104498.43 |
| 33 | 2020.03.17 13:46 | buy | 17 | 2.08 | 0.95635 | 0.95005 | 0.95835 | ||
| 34 | 2020.03.17 14:13 | t/p | 17 | 2.08 | 0.95835 | 0.95005 | 0.95835 | 434.08 | 104932.51 |
| 35 | 2020.03.17 15:57 | buy | 18 | 2.09 | 0.96164 | 0.95534 | 0.96364 | ||
| 36 | 2020.03.17 18:57 | t/p | 18 | 2.09 | 0.96364 | 0.95534 | 0.96364 | 433.77 | 105366.28 |
| 37 | 2020.03.18 16:48 | buy | 19 | 2.10 | 0.96771 | 0.96141 | 0.96971 | ||
| 38 | 2020.03.18 17:58 | t/p | 19 | 2.10 | 0.96971 | 0.96141 | 0.96971 | 433.12 | 105799.40 |
| 39 | 2020.03.18 18:58 | buy | 20 | 2.11 | 0.97397 | 0.96767 | 0.97597 | ||
| 40 | 2020.03.18 22:54 | s/l | 20 | 2.11 | 0.96767 | 0.96767 | 0.97597 | -1373.71 | 104425.69 |
| 41 | 2020.03.24 09:50 | sell | 21 | 2.08 | 0.97507 | 0.98137 | 0.97307 | ||
| 42 | 2020.03.24 13:04 | t/p | 21 | 2.08 | 0.97307 | 0.98137 | 0.97307 | 427.51 | 104853.20 |
| 43 | 2020.03.27 18:53 | sell | 22 | 2.09 | 0.95612 | 0.96242 | 0.95412 | ||
| 44 | 2020.03.27 21:01 | t/p | 22 | 2.09 | 0.95412 | 0.96242 | 0.95412 | 438.10 | 105291.30 |
| 45 | 2020.04.02 16:14 | buy | 23 | 2.10 | 0.97148 | 0.96518 | 0.97348 | ||
| 46 | 2020.04.02 19:29 | t/p | 23 | 2.10 | 0.97348 | 0.96518 | 0.97348 | 431.44 | 105722.74 |
| 47 | 2020.04.03 15:59 | buy | 24 | 2.11 | 0.97937 | 0.97307 | 0.98137 | ||
| 48 | 2020.04.03 23:00 | close | 24 | 2.11 | 0.97642 | 0.97307 | 0.98137 | -637.48 | 105085.26 |
| 49 | 2020.04.07 15:21 | sell | 25 | 2.10 | 0.97054 | 0.97684 | 0.96854 | ||
| 50 | 2020.04.09 16:13 | t/p | 25 | 2.10 | 0.96854 | 0.97684 | 0.96854 | 390.96 | 105476.22 |
| 51 | 2020.04.13 09:42 | sell | 26 | 2.10 | 0.96305 | 0.96935 | 0.96105 | ||
| 52 | 2020.04.14 15:30 | t/p | 26 | 2.10 | 0.96105 | 0.96935 | 0.96105 | 426.35 | 105902.57 |
| 53 | 2020.04.15 13:35 | buy | 27 | 2.11 | 0.96619 | 0.95989 | 0.96819 | ||
| 54 | 2020.04.15 15:31 | t/p | 27 | 2.11 | 0.96819 | 0.95989 | 0.96819 | 435.86 | 106338.43 |
| 55 | 2020.04.21 05:24 | buy | 28 | 2.12 | 0.97155 | 0.96525 | 0.97355 | ||
| 56 | 2020.04.23 10:20 | t/p | 28 | 2.12 | 0.97355 | 0.96525 | 0.97355 | 435.79 | 106774.22 |
| 57 | 2020.04.23 12:58 | buy | 29 | 2.13 | 0.97626 | 0.96996 | 0.97826 | ||
| 58 | 2020.04.24 09:55 | t/p | 29 | 2.13 | 0.97826 | 0.96996 | 0.97826 | 435.54 | 107209.76 |
| 59 | 2020.04.28 09:24 | buy | 30 | 2.14 | 0.97799 | 0.97169 | 0.97999 | ||
| 60 | 2020.04.29 10:36 | s/l | 30 | 2.14 | 0.97169 | 0.97169 | 0.97999 | -1387.41 | 105822.35 |
| 61 | 2020.04.30 17:55 | sell | 31 | 2.11 | 0.96743 | 0.97373 | 0.96543 | ||
| 62 | 2020.04.30 17:58 | t/p | 31 | 2.11 | 0.96543 | 0.97373 | 0.96543 | 437.11 | 106259.46 |
| 63 | 2020.05.01 17:35 | sell | 32 | 2.12 | 0.95950 | 0.96580 | 0.95750 | ||
| 64 | 2020.05.01 23:00 | close | 32 | 2.12 | 0.96144 | 0.96580 | 0.95750 | -427.78 | 105831.68 |
| 65 | 2020.05.05 10:02 | buy | 33 | 2.11 | 0.96745 | 0.96115 | 0.96945 | ||
| 66 | 2020.05.05 11:48 | t/p | 33 | 2.11 | 0.96945 | 0.96115 | 0.96945 | 435.30 | 106266.98 |
| 67 | 2020.05.05 12:10 | buy | 34 | 2.12 | 0.97211 | 0.96581 | 0.97411 | ||
| 68 | 2020.05.06 11:09 | t/p | 34 | 2.12 | 0.97411 | 0.96581 | 0.97411 | 435.34 | 106702.31 |
| 69 | 2020.05.08 17:49 | sell | 35 | 2.13 | 0.96920 | 0.97550 | 0.96720 | ||
| 70 | 2020.05.08 23:00 | close | 35 | 2.13 | 0.97131 | 0.97550 | 0.96720 | -462.71 | 106239.60 |