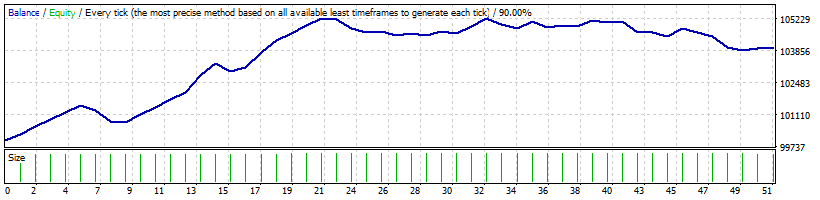
Strategy Tester Report
USIndexExpert
FXDD-MT4 Demo Server (Build 1260)
| Symbol | USDCHF (United States Dollar vs. Swiss Franc) | ||||
| Period | 1 Hour (H1) 2020.02.24 00:00 - 2020.06.05 23:00 (2020.02.24 - 2020.06.06) | ||||
| Model | Every tick (the most precise method based on all available least timeframes) | ||||
| Parameters | TrackPeriod=15; TRRR=0.5; UpATRR=2; DownATRR=0.5; DPR=0.5; StopLoss=400; TakeProfit=300; TS=300; MaxSpread=30; MUR=0.01; SOLR=5; CDH=24; BandDeviation=2; BandPeriod=20; MinDeviation=50; OpenFlag=15; PassbyFlag=3; | ||||
| Bars in test | 2800 | Ticks modelled | 8817674 | Modelling quality | 90.00% |
| Mismatched charts errors | 1 | ||||
| Initial deposit | 100000.00 | Spread | 30 | ||
| Total net profit | 3998.03 | Gross profit | 8405.02 | Gross loss | -4406.99 |
| Profit factor | 1.91 | Expected payoff | 78.39 | ||
| Absolute drawdown | 418.17 | Maximal drawdown | 1609.82 (1.53%) | Relative drawdown | 1.53% (1609.82) |
| Total trades | 51 | Short positions (won %) | 38 (65.79%) | Long positions (won %) | 13 (38.46%) |
| Profit trades (% of total) | 30 (58.82%) | Loss trades (% of total) | 21 (41.18%) | ||
| Largest | profit trade | 722.42 | loss trade | -469.67 | |
| Average | profit trade | 280.17 | loss trade | -209.86 | |
| Maximum | consecutive wins (profit in money) | 6 (2511.74) | consecutive losses (loss in money) | 4 (-926.20) | |
| Maximal | consecutive profit (count of wins) | 2511.74 (6) | consecutive loss (count of losses) | -926.20 (4) | |
| Average | consecutive wins | 2 | consecutive losses | 2 | |
| # | Time | Type | Order | Size | Price | S / L | T / P | Profit | Balance |
| 1 | 2020.02.26 10:46 | sell | 1 | 1.00 | 0.97399 | 0.97829 | 0.97099 | ||
| 2 | 2020.02.27 13:56 | t/p | 1 | 1.00 | 0.97099 | 0.97829 | 0.97099 | 293.83 | 100293.83 |
| 3 | 2020.02.27 14:35 | sell | 2 | 1.00 | 0.96990 | 0.97420 | 0.96690 | ||
| 4 | 2020.02.28 09:33 | t/p | 2 | 1.00 | 0.96690 | 0.97420 | 0.96690 | 305.23 | 100599.06 |
| 5 | 2020.02.28 10:22 | sell | 3 | 1.00 | 0.96527 | 0.96957 | 0.96227 | ||
| 6 | 2020.02.28 11:10 | t/p | 3 | 1.00 | 0.96227 | 0.96957 | 0.96227 | 311.77 | 100910.83 |
| 7 | 2020.02.28 13:00 | buy | 4 | 1.00 | 0.96404 | 0.96160 | 0.00000 | ||
| 8 | 2020.02.28 16:30 | close | 4 | 1.00 | 0.96694 | 0.96160 | 0.00000 | 299.92 | 101210.75 |
| 9 | 2020.03.02 13:33 | sell | 5 | 1.01 | 0.95904 | 0.96334 | 0.95604 | ||
| 10 | 2020.03.02 15:36 | t/p | 5 | 1.01 | 0.95604 | 0.96334 | 0.95604 | 316.93 | 101527.68 |
| 11 | 2020.03.02 16:00 | buy | 6 | 1.01 | 0.95693 | 0.95469 | 0.00000 | ||
| 12 | 2020.03.02 17:06 | s/l | 6 | 1.01 | 0.95469 | 0.95469 | 0.00000 | -236.98 | 101290.70 |
| 13 | 2020.03.03 17:16 | sell | 7 | 1.01 | 0.95228 | 0.95658 | 0.94928 | ||
| 14 | 2020.03.03 18:11 | s/l | 7 | 1.01 | 0.95658 | 0.95658 | 0.94928 | -454.01 | 100836.69 |
| 15 | 2020.03.05 14:00 | buy | 8 | 1.00 | 0.95294 | 0.95254 | 0.00000 | ||
| 16 | 2020.03.05 14:02 | s/l | 8 | 1.00 | 0.95254 | 0.95254 | 0.00000 | -41.99 | 100794.70 |
| 17 | 2020.03.05 18:35 | sell | 9 | 1.00 | 0.94937 | 0.95367 | 0.94637 | ||
| 18 | 2020.03.05 22:57 | t/p | 9 | 1.00 | 0.94637 | 0.95367 | 0.94637 | 317.00 | 101111.70 |
| 19 | 2020.03.06 10:32 | sell | 10 | 1.01 | 0.94209 | 0.94639 | 0.93909 | ||
| 20 | 2020.03.06 11:56 | t/p | 10 | 1.01 | 0.93909 | 0.94639 | 0.93909 | 322.65 | 101434.35 |
| 21 | 2020.03.06 12:25 | sell | 11 | 1.01 | 0.93694 | 0.94124 | 0.93394 | ||
| 22 | 2020.03.06 16:14 | t/p | 11 | 1.01 | 0.93394 | 0.94124 | 0.93394 | 324.43 | 101758.78 |
| 23 | 2020.03.09 04:49 | sell | 12 | 1.01 | 0.92441 | 0.92871 | 0.92141 | ||
| 24 | 2020.03.09 04:49 | t/p | 12 | 1.01 | 0.92141 | 0.92871 | 0.92141 | 328.86 | 102087.64 |
| 25 | 2020.03.10 10:00 | sell | 13 | 1.02 | 0.93563 | 0.93827 | 0.00000 | ||
| 26 | 2020.03.10 11:03 | close | 13 | 1.02 | 0.92905 | 0.93827 | 0.00000 | 722.42 | 102810.06 |
| 27 | 2020.03.12 20:00 | sell | 14 | 1.02 | 0.94833 | 0.95263 | 0.00000 | ||
| 28 | 2020.03.13 06:51 | close | 14 | 1.02 | 0.94369 | 0.95263 | 0.00000 | 496.38 | 103306.44 |
| 29 | 2020.03.13 18:00 | sell | 15 | 1.03 | 0.95053 | 0.95361 | 0.00000 | ||
| 30 | 2020.03.13 18:35 | s/l | 15 | 1.03 | 0.95361 | 0.95361 | 0.00000 | -332.67 | 102973.77 |
| 31 | 2020.03.17 18:00 | sell | 16 | 1.02 | 0.96156 | 0.96549 | 0.00000 | ||
| 32 | 2020.03.18 06:01 | close | 16 | 1.02 | 0.95982 | 0.96549 | 0.00000 | 179.77 | 103153.54 |
| 33 | 2020.03.18 21:00 | sell | 17 | 1.03 | 0.97110 | 0.97540 | 0.00000 | ||
| 34 | 2020.03.19 02:04 | close | 17 | 1.03 | 0.96499 | 0.97540 | 0.00000 | 636.58 | 103790.12 |
| 35 | 2020.03.19 21:00 | sell | 18 | 1.03 | 0.98617 | 0.99013 | 0.00000 | ||
| 36 | 2020.03.20 05:07 | close | 18 | 1.03 | 0.98135 | 0.99013 | 0.00000 | 500.70 | 104290.81 |
| 37 | 2020.03.26 14:22 | sell | 19 | 1.04 | 0.96946 | 0.97376 | 0.96646 | ||
| 38 | 2020.03.26 18:24 | t/p | 19 | 1.04 | 0.96646 | 0.97376 | 0.96646 | 322.83 | 104613.64 |
| 39 | 2020.03.26 19:57 | sell | 20 | 1.04 | 0.96291 | 0.96721 | 0.95991 | ||
| 40 | 2020.03.27 05:53 | t/p | 20 | 1.04 | 0.95991 | 0.96721 | 0.95991 | 319.80 | 104933.44 |
| 41 | 2020.03.27 18:53 | sell | 21 | 1.04 | 0.95632 | 0.96062 | 0.95332 | ||
| 42 | 2020.03.27 21:58 | t/p | 21 | 1.04 | 0.95332 | 0.96062 | 0.95332 | 327.28 | 105260.72 |
| 43 | 2020.03.31 14:00 | sell | 22 | 1.05 | 0.96537 | 0.96591 | 0.00000 | ||
| 44 | 2020.03.31 14:00 | s/l | 22 | 1.05 | 0.96591 | 0.96591 | 0.00000 | -58.70 | 105202.02 |
| 45 | 2020.03.31 16:00 | sell | 23 | 1.05 | 0.96494 | 0.96829 | 0.00000 | ||
| 46 | 2020.03.31 17:58 | s/l | 23 | 1.05 | 0.96829 | 0.96829 | 0.00000 | -363.27 | 104838.75 |
| 47 | 2020.04.07 13:00 | buy | 24 | 1.04 | 0.97340 | 0.97160 | 0.00000 | ||
| 48 | 2020.04.07 15:17 | s/l | 24 | 1.04 | 0.97160 | 0.97160 | 0.00000 | -192.67 | 104646.08 |
| 49 | 2020.04.09 16:24 | sell | 25 | 1.04 | 0.96683 | 0.97113 | 0.96383 | ||
| 50 | 2020.04.10 10:57 | close | 25 | 1.04 | 0.96638 | 0.97113 | 0.96383 | 43.19 | 104689.27 |
| 51 | 2020.04.14 08:00 | buy | 26 | 1.04 | 0.96481 | 0.96335 | 0.00000 | ||
| 52 | 2020.04.14 12:44 | s/l | 26 | 1.04 | 0.96335 | 0.96335 | 0.00000 | -157.62 | 104531.65 |
| 53 | 2020.04.14 14:48 | sell | 27 | 1.04 | 0.96192 | 0.96622 | 0.95892 | ||
| 54 | 2020.04.15 06:32 | close | 27 | 1.04 | 0.96115 | 0.96622 | 0.95892 | 78.08 | 104609.72 |
| 55 | 2020.04.15 13:00 | sell | 28 | 1.04 | 0.96370 | 0.96453 | 0.00000 | ||
| 56 | 2020.04.15 13:28 | s/l | 28 | 1.04 | 0.96453 | 0.96453 | 0.00000 | -89.49 | 104520.23 |
| 57 | 2020.04.15 18:00 | sell | 29 | 1.04 | 0.96532 | 0.96962 | 0.00000 | ||
| 58 | 2020.04.15 21:12 | close | 29 | 1.04 | 0.96358 | 0.96962 | 0.00000 | 187.80 | 104708.03 |
| 59 | 2020.04.21 08:00 | sell | 30 | 1.04 | 0.97063 | 0.97169 | 0.00000 | ||
| 60 | 2020.04.21 11:01 | s/l | 30 | 1.04 | 0.97169 | 0.97169 | 0.00000 | -113.45 | 104594.58 |
| 61 | 2020.04.23 15:00 | sell | 31 | 1.04 | 0.97617 | 0.97657 | 0.00000 | ||
| 62 | 2020.04.23 17:14 | close | 31 | 1.04 | 0.97323 | 0.97657 | 0.00000 | 314.17 | 104908.75 |
| 63 | 2020.04.30 17:54 | sell | 32 | 1.04 | 0.96841 | 0.97271 | 0.96541 | ||
| 64 | 2020.04.30 17:58 | t/p | 32 | 1.04 | 0.96541 | 0.97271 | 0.96541 | 323.18 | 105231.93 |
| 65 | 2020.04.30 20:00 | buy | 33 | 1.05 | 0.96659 | 0.96435 | 0.00000 | ||
| 66 | 2020.05.01 08:23 | s/l | 33 | 1.05 | 0.96435 | 0.96435 | 0.00000 | -243.87 | 104988.06 |
| 67 | 2020.05.01 17:35 | sell | 34 | 1.04 | 0.95972 | 0.96402 | 0.95672 | ||
| 68 | 2020.05.01 23:00 | close | 34 | 1.04 | 0.96144 | 0.96402 | 0.95672 | -186.05 | 104802.01 |
| 69 | 2020.05.05 11:58 | buy | 35 | 1.04 | 0.97087 | 0.96657 | 0.97387 | ||
| 70 | 2020.05.06 11:05 | t/p | 35 | 1.04 | 0.97387 | 0.96657 | 0.97387 | 320.39 | 105122.40 |
| 71 | 2020.05.08 17:49 | sell | 36 | 1.05 | 0.96907 | 0.97337 | 0.96607 | ||
| 72 | 2020.05.08 23:00 | close | 36 | 1.05 | 0.97131 | 0.97337 | 0.96607 | -242.15 | 104880.25 |
| 73 | 2020.05.12 06:00 | sell | 37 | 1.04 | 0.97366 | 0.97480 | 0.00000 | ||
| 74 | 2020.05.12 08:05 | close | 37 | 1.04 | 0.97302 | 0.97480 | 0.00000 | 68.41 | 104948.66 |
| 75 | 2020.05.12 16:00 | buy | 38 | 1.04 | 0.96887 | 0.96847 | 0.00000 | ||
| 76 | 2020.05.12 16:02 | s/l | 38 | 1.04 | 0.96847 | 0.96847 | 0.00000 | -42.96 | 104905.70 |
| 77 | 2020.05.12 18:00 | buy | 39 | 1.04 | 0.96709 | 0.96625 | 0.00000 | ||
| 78 | 2020.05.13 02:19 | close | 39 | 1.04 | 0.96970 | 0.96625 | 0.00000 | 279.94 | 105185.64 |
| 79 | 2020.05.13 22:00 | sell | 40 | 1.05 | 0.97221 | 0.97303 | 0.00000 | ||
| 80 | 2020.05.14 04:47 | s/l | 40 | 1.05 | 0.97303 | 0.97303 | 0.00000 | -104.37 | 105081.26 |
| 81 | 2020.05.15 18:07 | buy | 41 | 1.05 | 0.97232 | 0.97086 | 0.00000 | ||
| 82 | 2020.05.15 18:26 | close | 41 | 1.05 | 0.97254 | 0.97086 | 0.00000 | 23.75 | 105105.01 |
| 83 | 2020.05.18 18:19 | sell | 42 | 1.05 | 0.96825 | 0.97255 | 0.96525 | ||
| 84 | 2020.05.18 19:56 | s/l | 42 | 1.05 | 0.97255 | 0.97255 | 0.96525 | -464.24 | 104640.77 |
| 85 | 2020.05.20 12:18 | sell | 43 | 1.04 | 0.96612 | 0.97042 | 0.96312 | ||
| 86 | 2020.05.21 03:54 | close | 43 | 1.04 | 0.96591 | 0.97042 | 0.96312 | 6.88 | 104647.65 |
| 87 | 2020.05.21 20:00 | sell | 44 | 1.04 | 0.97000 | 0.97146 | 0.00000 | ||
| 88 | 2020.05.21 23:08 | s/l | 44 | 1.04 | 0.97146 | 0.97146 | 0.00000 | -156.30 | 104491.35 |
| 89 | 2020.05.26 11:06 | sell | 45 | 1.04 | 0.96861 | 0.97291 | 0.96561 | ||
| 90 | 2020.05.26 17:07 | t/p | 45 | 1.04 | 0.96561 | 0.97291 | 0.96561 | 323.11 | 104814.46 |
| 91 | 2020.05.27 13:00 | sell | 46 | 1.04 | 0.96943 | 0.97093 | 0.00000 | ||
| 92 | 2020.05.27 15:05 | s/l | 46 | 1.04 | 0.97093 | 0.97093 | 0.00000 | -160.67 | 104653.79 |
| 93 | 2020.05.28 21:00 | buy | 47 | 1.04 | 0.96432 | 0.96266 | 0.00000 | ||
| 94 | 2020.05.29 07:47 | s/l | 47 | 1.04 | 0.96266 | 0.96266 | 0.00000 | -179.32 | 104474.47 |
| 95 | 2020.06.01 11:36 | sell | 48 | 1.04 | 0.95859 | 0.96289 | 0.95559 | ||
| 96 | 2020.06.02 13:01 | s/l | 48 | 1.04 | 0.96289 | 0.96289 | 0.95559 | -469.67 | 104004.80 |
| 97 | 2020.06.04 20:00 | buy | 49 | 1.04 | 0.95602 | 0.95495 | 0.00000 | ||
| 98 | 2020.06.04 20:12 | s/l | 49 | 1.04 | 0.95495 | 0.95495 | 0.00000 | -116.53 | 103888.27 |
| 99 | 2020.06.04 22:00 | buy | 50 | 1.03 | 0.95523 | 0.95263 | 0.00000 | ||
| 100 | 2020.06.05 08:06 | close | 50 | 1.03 | 0.95605 | 0.95263 | 0.00000 | 88.36 | 103976.62 |
| 101 | 2020.06.05 18:00 | sell | 51 | 1.03 | 0.96239 | 0.96469 | 0.00000 | ||
| 102 | 2020.06.05 23:00 | close | 51 | 1.03 | 0.96219 | 0.96469 | 0.00000 | 21.41 | 103998.03 |