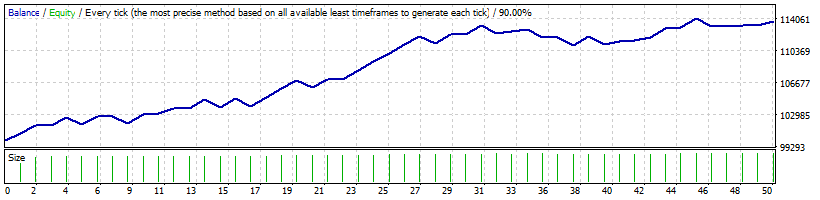
Strategy Tester Report
USIndexExpert
FXDD-MT4 Demo Server (Build 1260)
| Symbol | USDJPY (United States Dollar vs. Japanese Yen) | ||||
| Period | 30 Minutes (M30) 2020.02.17 00:00 - 2020.05.29 23:30 (2020.02.17 - 2020.05.31) | ||||
| Model | Every tick (the most precise method based on all available least timeframes) | ||||
| Parameters | TrackPeriod=20; TRRR=1; UpATRR=0.5; DownATRR=1; DPR=0.5; StopLoss=400; TakeProfit=500; TS=300; MaxSpread=30; MUR=0.02; SOLR=5; CDH=24; BandDeviation=2; BandPeriod=20; MinDeviation=50; OpenFlag=15; PassbyFlag=2; | ||||
| Bars in test | 4600 | Ticks modelled | 15081231 | Modelling quality | 90.00% |
| Mismatched charts errors | 0 | ||||
| Initial deposit | 100000.00 | Spread | 30 | ||
| Total net profit | 13773.08 | Gross profit | 23391.75 | Gross loss | -9618.67 |
| Profit factor | 2.43 | Expected payoff | 275.46 | ||
| Absolute drawdown | 527.10 | Maximal drawdown | 2953.18 (2.60%) | Relative drawdown | 2.60% (2953.18) |
| Total trades | 50 | Short positions (won %) | 17 (76.47%) | Long positions (won %) | 33 (75.76%) |
| Profit trades (% of total) | 38 (76.00%) | Loss trades (% of total) | 12 (24.00%) | ||
| Largest | profit trade | 1046.86 | loss trade | -931.73 | |
| Average | profit trade | 615.57 | loss trade | -801.56 | |
| Maximum | consecutive wins (profit in money) | 7 (5944.31) | consecutive losses (loss in money) | 2 (-804.25) | |
| Maximal | consecutive profit (count of wins) | 5944.31 (7) | consecutive loss (count of losses) | -931.73 (1) | |
| Average | consecutive wins | 3 | consecutive losses | 1 | |
| # | Time | Type | Order | Size | Price | S / L | T / P | Profit | Balance |
| 1 | 2020.02.17 16:54 | buy | 1 | 2.00 | 109.937 | 109.507 | 110.437 | ||
| 2 | 2020.02.19 13:55 | t/p | 1 | 2.00 | 110.437 | 109.507 | 110.437 | 905.56 | 100905.56 |
| 3 | 2020.02.19 14:55 | buy | 2 | 2.01 | 110.512 | 110.082 | 111.012 | ||
| 4 | 2020.02.19 18:15 | t/p | 2 | 2.01 | 111.012 | 110.082 | 111.012 | 905.31 | 101810.87 |
| 5 | 2020.02.19 18:35 | buy | 3 | 2.03 | 111.234 | 110.804 | 111.734 | ||
| 6 | 2020.02.20 03:38 | close | 3 | 2.03 | 111.235 | 110.804 | 111.734 | 1.93 | 101812.80 |
| 7 | 2020.02.20 09:19 | buy | 4 | 2.03 | 111.711 | 111.281 | 112.211 | ||
| 8 | 2020.02.20 16:55 | t/p | 4 | 2.03 | 112.211 | 111.281 | 112.211 | 904.55 | 102717.35 |
| 9 | 2020.02.21 10:10 | sell | 5 | 2.05 | 111.519 | 111.949 | 111.019 | ||
| 10 | 2020.02.21 14:02 | s/l | 5 | 2.05 | 111.949 | 111.949 | 111.019 | -787.41 | 101929.94 |
| 11 | 2020.02.24 16:10 | sell | 6 | 2.03 | 111.061 | 111.491 | 110.561 | ||
| 12 | 2020.02.24 17:29 | t/p | 6 | 2.03 | 110.561 | 111.491 | 110.561 | 918.05 | 102847.99 |
| 13 | 2020.02.25 17:18 | sell | 7 | 2.05 | 110.177 | 110.607 | 109.677 | ||
| 14 | 2020.02.26 03:14 | close | 7 | 2.05 | 110.176 | 110.607 | 109.677 | -4.85 | 102843.14 |
| 15 | 2020.02.26 16:41 | buy | 8 | 2.05 | 110.700 | 110.270 | 111.200 | ||
| 16 | 2020.02.26 19:18 | s/l | 8 | 2.05 | 110.270 | 110.270 | 111.200 | -799.40 | 102043.74 |
| 17 | 2020.02.28 17:24 | sell | 9 | 2.04 | 108.124 | 108.554 | 107.624 | ||
| 18 | 2020.02.28 22:28 | t/p | 9 | 2.04 | 107.624 | 108.554 | 107.624 | 947.74 | 102991.48 |
| 19 | 2020.03.03 17:15 | sell | 10 | 2.05 | 107.327 | 107.757 | 106.827 | ||
| 20 | 2020.03.04 02:06 | close | 10 | 2.05 | 107.229 | 107.757 | 106.827 | 180.65 | 103172.13 |
| 21 | 2020.03.05 19:48 | sell | 11 | 2.06 | 106.265 | 106.695 | 105.765 | ||
| 22 | 2020.03.06 08:38 | close | 11 | 2.06 | 105.999 | 106.695 | 105.765 | 510.21 | 103682.34 |
| 23 | 2020.03.06 11:45 | sell | 12 | 2.07 | 105.429 | 105.859 | 104.929 | ||
| 24 | 2020.03.06 18:41 | close | 12 | 2.07 | 105.397 | 105.859 | 104.929 | 62.85 | 103745.19 |
| 25 | 2020.03.09 04:49 | sell | 13 | 2.07 | 103.070 | 103.500 | 102.570 | ||
| 26 | 2020.03.09 04:49 | t/p | 13 | 2.07 | 102.570 | 103.500 | 102.570 | 1009.11 | 104754.30 |
| 27 | 2020.03.10 03:57 | buy | 14 | 2.09 | 103.513 | 103.083 | 104.013 | ||
| 28 | 2020.03.10 05:06 | s/l | 14 | 2.09 | 103.083 | 103.083 | 104.013 | -871.82 | 103882.48 |
| 29 | 2020.03.10 07:25 | buy | 15 | 2.07 | 104.096 | 103.666 | 104.596 | ||
| 30 | 2020.03.10 08:10 | t/p | 15 | 2.07 | 104.596 | 103.666 | 104.596 | 989.52 | 104872.00 |
| 31 | 2020.03.10 22:14 | buy | 16 | 2.09 | 105.641 | 105.211 | 106.141 | ||
| 32 | 2020.03.11 00:59 | s/l | 16 | 2.09 | 105.211 | 105.211 | 106.141 | -854.15 | 104017.85 |
| 33 | 2020.03.12 04:29 | sell | 17 | 2.08 | 103.679 | 104.109 | 103.179 | ||
| 34 | 2020.03.12 05:05 | t/p | 17 | 2.08 | 103.179 | 104.109 | 103.179 | 1007.96 | 105025.81 |
| 35 | 2020.03.12 17:13 | buy | 18 | 2.10 | 105.067 | 104.637 | 105.567 | ||
| 36 | 2020.03.12 18:41 | t/p | 18 | 2.10 | 105.567 | 104.637 | 105.567 | 994.63 | 106020.44 |
| 37 | 2020.03.13 13:14 | buy | 19 | 2.12 | 106.567 | 106.137 | 107.067 | ||
| 38 | 2020.03.13 15:12 | t/p | 19 | 2.12 | 107.067 | 106.137 | 107.067 | 990.03 | 107010.47 |
| 39 | 2020.03.13 15:32 | buy | 20 | 2.14 | 107.406 | 106.976 | 107.906 | ||
| 40 | 2020.03.13 16:40 | s/l | 20 | 2.14 | 106.976 | 106.976 | 107.906 | -860.19 | 106150.28 |
| 41 | 2020.03.13 19:41 | buy | 21 | 2.12 | 107.765 | 107.335 | 108.265 | ||
| 42 | 2020.03.13 22:07 | t/p | 21 | 2.12 | 108.265 | 107.335 | 108.265 | 979.07 | 107129.35 |
| 43 | 2020.03.17 17:46 | buy | 22 | 2.14 | 107.423 | 106.993 | 107.923 | ||
| 44 | 2020.03.18 02:19 | close | 22 | 2.14 | 107.424 | 106.993 | 107.923 | 2.03 | 107131.37 |
| 45 | 2020.03.18 16:48 | buy | 23 | 2.14 | 108.035 | 107.605 | 108.535 | ||
| 46 | 2020.03.18 19:00 | t/p | 23 | 2.14 | 108.535 | 107.605 | 108.535 | 985.86 | 108117.23 |
| 47 | 2020.03.19 03:54 | buy | 24 | 2.16 | 108.865 | 108.435 | 109.365 | ||
| 48 | 2020.03.19 05:13 | t/p | 24 | 2.16 | 109.365 | 108.435 | 109.365 | 987.50 | 109104.73 |
| 49 | 2020.03.19 14:26 | buy | 25 | 2.18 | 109.810 | 109.380 | 110.310 | ||
| 50 | 2020.03.19 20:16 | t/p | 25 | 2.18 | 110.310 | 109.380 | 110.310 | 988.12 | 110092.85 |
| 51 | 2020.03.19 21:34 | buy | 26 | 2.20 | 110.765 | 110.335 | 111.265 | ||
| 52 | 2020.03.20 02:39 | t/p | 26 | 2.20 | 111.265 | 110.335 | 111.265 | 988.67 | 111081.52 |
| 53 | 2020.03.26 11:58 | sell | 27 | 2.22 | 110.070 | 110.500 | 109.570 | ||
| 54 | 2020.03.26 16:06 | t/p | 27 | 2.22 | 109.570 | 110.500 | 109.570 | 1013.06 | 112094.58 |
| 55 | 2020.03.31 03:51 | buy | 28 | 2.24 | 108.474 | 108.044 | 108.974 | ||
| 56 | 2020.03.31 16:37 | s/l | 28 | 2.24 | 108.044 | 108.044 | 108.974 | -891.49 | 111203.09 |
| 57 | 2020.04.02 17:31 | buy | 29 | 2.22 | 107.686 | 107.256 | 108.186 | ||
| 58 | 2020.04.03 02:27 | t/p | 29 | 2.22 | 108.186 | 107.256 | 108.186 | 1026.05 | 112229.14 |
| 59 | 2020.04.03 12:09 | buy | 30 | 2.24 | 108.429 | 107.999 | 108.929 | ||
| 60 | 2020.04.03 20:08 | close | 30 | 2.24 | 108.439 | 107.999 | 108.929 | 20.66 | 112249.80 |
| 61 | 2020.04.06 03:03 | buy | 31 | 2.24 | 108.852 | 108.422 | 109.352 | ||
| 62 | 2020.04.06 10:32 | t/p | 31 | 2.24 | 109.352 | 108.422 | 109.352 | 1024.22 | 113274.02 |
| 63 | 2020.04.08 16:05 | buy | 32 | 2.26 | 109.094 | 108.664 | 109.594 | ||
| 64 | 2020.04.08 17:49 | s/l | 32 | 2.26 | 108.664 | 108.664 | 109.594 | -894.32 | 112379.70 |
| 65 | 2020.04.13 04:13 | sell | 33 | 2.24 | 108.107 | 108.537 | 107.607 | ||
| 66 | 2020.04.13 12:08 | close | 33 | 2.24 | 108.018 | 108.537 | 107.607 | 184.56 | 112564.26 |
| 67 | 2020.04.15 15:49 | buy | 34 | 2.25 | 107.604 | 107.174 | 108.104 | ||
| 68 | 2020.04.16 09:45 | close | 34 | 2.25 | 107.716 | 107.174 | 108.104 | 234.07 | 112798.34 |
| 69 | 2020.04.23 16:38 | buy | 35 | 2.25 | 107.932 | 107.502 | 108.432 | ||
| 70 | 2020.04.23 19:51 | s/l | 35 | 2.25 | 107.502 | 107.502 | 108.432 | -899.98 | 111898.36 |
| 71 | 2020.04.28 12:19 | sell | 36 | 2.23 | 106.885 | 107.315 | 106.385 | ||
| 72 | 2020.04.28 17:46 | close | 36 | 2.23 | 106.876 | 107.315 | 106.385 | 18.78 | 111917.14 |
| 73 | 2020.04.29 10:36 | sell | 37 | 2.23 | 106.382 | 106.812 | 105.882 | ||
| 74 | 2020.04.30 03:38 | s/l | 37 | 2.23 | 106.812 | 106.812 | 105.882 | -919.65 | 110997.49 |
| 75 | 2020.04.30 17:48 | buy | 38 | 2.21 | 106.962 | 106.532 | 107.462 | ||
| 76 | 2020.04.30 22:31 | t/p | 38 | 2.21 | 107.462 | 106.532 | 107.462 | 1028.27 | 112025.76 |
| 77 | 2020.05.04 17:22 | buy | 39 | 2.24 | 107.012 | 106.582 | 107.512 | ||
| 78 | 2020.05.05 03:21 | s/l | 39 | 2.24 | 106.582 | 106.582 | 107.512 | -903.68 | 111122.08 |
| 79 | 2020.05.06 03:10 | sell | 40 | 2.22 | 106.291 | 106.721 | 105.791 | ||
| 80 | 2020.05.06 22:03 | close | 40 | 2.22 | 106.119 | 106.721 | 105.791 | 359.82 | 111481.90 |
| 81 | 2020.05.07 10:46 | buy | 41 | 2.22 | 106.421 | 105.991 | 106.921 | ||
| 82 | 2020.05.07 18:21 | close | 41 | 2.22 | 106.446 | 105.991 | 106.921 | 52.14 | 111534.04 |
| 83 | 2020.05.08 15:31 | buy | 42 | 2.23 | 106.527 | 106.097 | 107.027 | ||
| 84 | 2020.05.08 23:00 | close | 42 | 2.23 | 106.699 | 106.097 | 107.027 | 359.48 | 111893.52 |
| 85 | 2020.05.11 09:36 | buy | 43 | 2.23 | 107.105 | 106.675 | 107.605 | ||
| 86 | 2020.05.11 18:11 | t/p | 43 | 2.23 | 107.605 | 106.675 | 107.605 | 1036.20 | 112929.72 |
| 87 | 2020.05.14 18:17 | buy | 44 | 2.25 | 107.176 | 106.746 | 107.676 | ||
| 88 | 2020.05.15 04:40 | close | 44 | 2.25 | 107.257 | 106.746 | 107.676 | 169.96 | 113099.68 |
| 89 | 2020.05.18 15:31 | buy | 45 | 2.26 | 107.446 | 107.016 | 107.946 | ||
| 90 | 2020.05.19 16:05 | t/p | 45 | 2.26 | 107.946 | 107.016 | 107.946 | 1046.86 | 114146.54 |
| 91 | 2020.05.20 17:18 | sell | 46 | 2.28 | 107.385 | 107.815 | 106.885 | ||
| 92 | 2020.05.21 09:49 | s/l | 46 | 2.28 | 107.815 | 107.815 | 106.885 | -931.73 | 113214.81 |
| 93 | 2020.05.25 02:36 | buy | 47 | 2.26 | 107.779 | 107.349 | 108.279 | ||
| 94 | 2020.05.26 10:53 | close | 47 | 2.26 | 107.797 | 107.349 | 108.279 | 37.78 | 113252.59 |
| 95 | 2020.05.26 14:12 | sell | 48 | 2.26 | 107.560 | 107.990 | 107.060 | ||
| 96 | 2020.05.26 23:34 | close | 48 | 2.26 | 107.546 | 107.990 | 107.060 | 29.42 | 113282.01 |
| 97 | 2020.05.27 14:23 | buy | 49 | 2.26 | 107.802 | 107.372 | 108.302 | ||
| 98 | 2020.05.28 11:00 | close | 49 | 2.26 | 107.807 | 107.372 | 108.302 | 10.60 | 113292.61 |
| 99 | 2020.05.29 03:55 | sell | 50 | 2.26 | 107.472 | 107.902 | 106.972 | ||
| 100 | 2020.05.29 14:00 | close | 50 | 2.26 | 107.244 | 107.902 | 106.972 | 480.47 | 113773.08 |